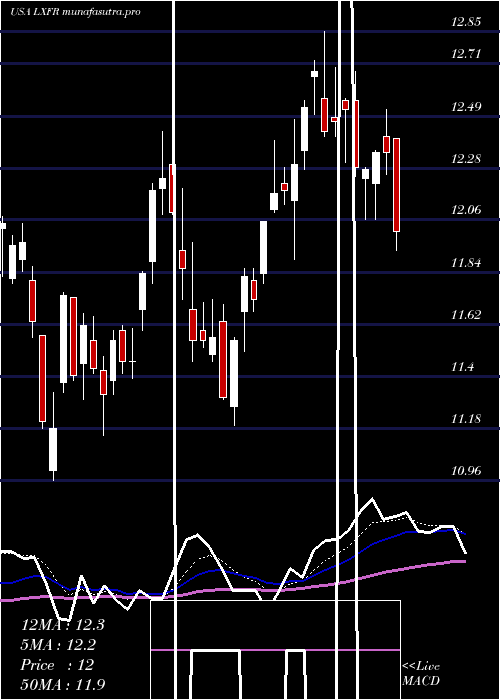
LuxferHoldings LXFR full analysis,charts,indicators,moving averages,SMA,DMA,EMA,ADX,MACD,RSILuxfer Holdings LXFR WideScreen charts, DMA,SMA,EMA technical analysis, forecast prediction, by indicators ADX,MACD,RSI,CCI USA stock exchange
operates under Basic Industries sector & deals in Major Chemicals
Daily price and charts and targets LuxferHoldings Strong Daily Stock price targets for LuxferHoldings LXFR are 12.86 and 13.2 | Daily Target 1 | 12.59 | | Daily Target 2 | 12.78 | | Daily Target 3 | 12.933333333333 | | Daily Target 4 | 13.12 | | Daily Target 5 | 13.27 |
Daily price and volume Luxfer Holdings
| Date |
Closing |
Open |
Range |
Volume |
Thu 04 December 2025 |
12.96 (0.86%) |
12.87 |
12.75 - 13.09 |
1.0347 times |
Wed 03 December 2025 |
12.85 (0.78%) |
12.82 |
12.57 - 12.88 |
1.1081 times |
Tue 02 December 2025 |
12.75 (0.71%) |
12.71 |
12.39 - 12.83 |
1.1222 times |
Mon 01 December 2025 |
12.66 (1.28%) |
12.36 |
12.35 - 12.73 |
1.1222 times |
Fri 28 November 2025 |
12.50 (-0.32%) |
12.57 |
12.37 - 12.57 |
0.912 times |
Wed 26 November 2025 |
12.54 (0.97%) |
12.38 |
12.35 - 12.58 |
0.7914 times |
Tue 25 November 2025 |
12.42 (2.9%) |
12.07 |
12.04 - 12.48 |
0.6405 times |
Mon 24 November 2025 |
12.07 (0.75%) |
12.00 |
11.87 - 12.17 |
0.8245 times |
Fri 21 November 2025 |
11.98 (2.74%) |
11.69 |
11.68 - 12.18 |
1.1352 times |
Thu 20 November 2025 |
11.66 (0.09%) |
11.88 |
11.52 - 11.94 |
1.3092 times |
Wed 19 November 2025 |
11.65 (-1.1%) |
11.74 |
11.62 - 11.98 |
0.7592 times |
Weekly price and charts LuxferHoldings Strong weekly Stock price targets for LuxferHoldings LXFR are 12.66 and 13.4 | Weekly Target 1 | 12.06 | | Weekly Target 2 | 12.51 | | Weekly Target 3 | 12.8 | | Weekly Target 4 | 13.25 | | Weekly Target 5 | 13.54 |
Weekly price and volumes for Luxfer Holdings
| Date |
Closing |
Open |
Range |
Volume |
Thu 04 December 2025 |
12.96 (3.68%) |
12.36 |
12.35 - 13.09 |
1.0814 times |
Fri 28 November 2025 |
12.50 (4.34%) |
12.00 |
11.87 - 12.58 |
0.781 times |
Fri 21 November 2025 |
11.98 (-0.75%) |
12.08 |
11.52 - 12.18 |
1.3287 times |
Fri 14 November 2025 |
12.07 (-2.19%) |
12.49 |
12.04 - 12.52 |
1.3024 times |
Fri 07 November 2025 |
12.34 (1.15%) |
12.23 |
12.08 - 12.75 |
0.9401 times |
Fri 31 October 2025 |
12.20 (0%) |
12.12 |
11.99 - 12.31 |
0.351 times |
Fri 31 October 2025 |
12.20 (-10.16%) |
13.68 |
11.99 - 13.68 |
1.4209 times |
Fri 24 October 2025 |
13.58 (6.18%) |
12.88 |
12.88 - 13.73 |
1.1584 times |
Fri 17 October 2025 |
12.79 (-3.76%) |
12.80 |
12.77 - 13.74 |
1.2705 times |
Tue 07 October 2025 |
13.29 (-3.7%) |
13.80 |
13.21 - 14.08 |
0.3656 times |
Fri 03 October 2025 |
13.80 (-1.43%) |
14.11 |
13.58 - 14.26 |
1.0915 times |

Monthly price and charts LuxferHoldings Strong monthly Stock price targets for LuxferHoldings LXFR are 12.66 and 13.4 | Monthly Target 1 | 12.06 | | Monthly Target 2 | 12.51 | | Monthly Target 3 | 12.8 | | Monthly Target 4 | 13.25 | | Monthly Target 5 | 13.54 |
Monthly price and volumes Luxfer Holdings
| Date |
Closing |
Open |
Range |
Volume |
Thu 04 December 2025 |
12.96 (3.68%) |
12.36 |
12.35 - 13.09 |
0.1954 times |
Fri 28 November 2025 |
12.50 (2.46%) |
12.23 |
11.52 - 12.75 |
0.7865 times |
Fri 31 October 2025 |
12.20 (-12.23%) |
13.74 |
11.99 - 14.08 |
0.9437 times |
Tue 30 September 2025 |
13.90 (3.58%) |
13.32 |
13.13 - 14.83 |
1.1343 times |
Fri 29 August 2025 |
13.42 (11.65%) |
11.87 |
11.34 - 13.86 |
1.2931 times |
Thu 31 July 2025 |
12.02 (-1.31%) |
12.14 |
11.56 - 13.50 |
1.195 times |
Mon 30 June 2025 |
12.18 (6.56%) |
11.42 |
11.15 - 12.43 |
1.0335 times |
Fri 30 May 2025 |
11.43 (6.23%) |
10.72 |
10.53 - 12.52 |
1.0741 times |
Wed 30 April 2025 |
10.76 (-9.27%) |
11.92 |
9.41 - 11.94 |
1.0923 times |
Mon 31 March 2025 |
11.86 (-2.79%) |
12.20 |
11.43 - 12.62 |
1.2522 times |
Fri 28 February 2025 |
12.20 (-13.78%) |
13.84 |
11.26 - 14.96 |
1.3181 times |

DMA SMA EMA moving averages of Luxfer Holdings LXFR
DMA (daily moving average) of Luxfer Holdings LXFR
| DMA period | DMA value | | 5 day DMA | 12.74 | | 12 day DMA | 12.32 | | 20 day DMA | 12.27 | | 35 day DMA | 12.55 | | 50 day DMA | 12.91 | | 100 day DMA | 12.85 | | 150 day DMA | 12.47 | | 200 day DMA | 12.3 | EMA (exponential moving average) of Luxfer Holdings LXFR
| EMA period | EMA current | EMA prev | EMA prev2 | | 5 day EMA | 12.75 | 12.64 | 12.54 | | 12 day EMA | 12.52 | 12.44 | 12.37 | | 20 day EMA | 12.48 | 12.43 | 12.39 | | 35 day EMA | 12.69 | 12.67 | 12.66 | | 50 day EMA | 13 | 13 | 13.01 |
SMA (simple moving average) of Luxfer Holdings LXFR
| SMA period | SMA current | SMA prev | SMA prev2 | | 5 day SMA | 12.74 | 12.66 | 12.57 | | 12 day SMA | 12.32 | 12.22 | 12.15 | | 20 day SMA | 12.27 | 12.25 | 12.23 | | 35 day SMA | 12.55 | 12.57 | 12.58 | | 50 day SMA | 12.91 | 12.93 | 12.97 | | 100 day SMA | 12.85 | 12.84 | 12.84 | | 150 day SMA | 12.47 | 12.45 | 12.43 | | 200 day SMA | 12.3 | 12.3 | 12.31 |
|
|
