LambWeston LW full analysis,charts,indicators,moving averages,SMA,DMA,EMA,ADX,MACD,RSILamb Weston LW WideScreen charts, DMA,SMA,EMA technical analysis, forecast prediction, by indicators ADX,MACD,RSI,CCI USA stock exchange
operates under Consumer Non Durables sector & deals in Packaged Foods
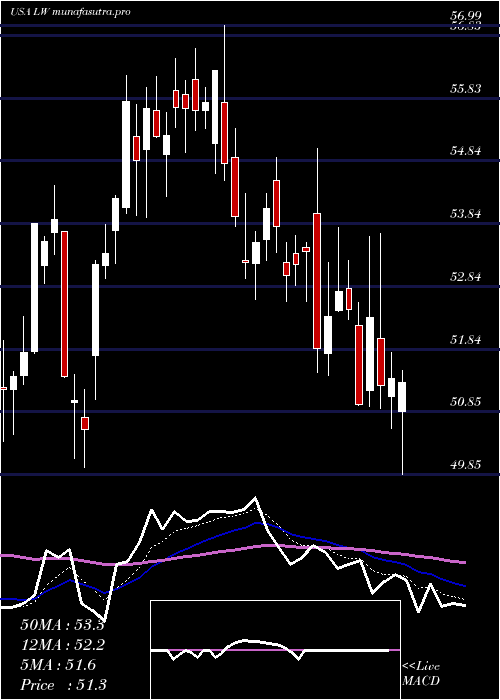
Daily price and charts and targets LambWeston Strong Daily Stock price targets for LambWeston LW are 58.97 and 60.38 | Daily Target 1 | 58.71 | | Daily Target 2 | 59.23 | | Daily Target 3 | 60.116666666667 | | Daily Target 4 | 60.64 | | Daily Target 5 | 61.53 |
Daily price and volume Lamb Weston
| Date |
Closing |
Open |
Range |
Volume |
Thu 04 December 2025 |
59.76 (-1.21%) |
61.00 |
59.59 - 61.00 |
0.8519 times |
Wed 03 December 2025 |
60.49 (2.44%) |
59.41 |
59.14 - 60.75 |
0.8457 times |
Tue 02 December 2025 |
59.05 (-0.76%) |
59.57 |
58.53 - 59.57 |
0.6478 times |
Mon 01 December 2025 |
59.50 (0.75%) |
59.06 |
58.95 - 60.05 |
0.8929 times |
Fri 28 November 2025 |
59.06 (-0.92%) |
59.47 |
59.05 - 59.91 |
0.3346 times |
Wed 26 November 2025 |
59.61 (1.02%) |
58.96 |
58.95 - 59.77 |
1.6219 times |
Tue 25 November 2025 |
59.01 (4.41%) |
56.81 |
56.57 - 59.17 |
1.3544 times |
Mon 24 November 2025 |
56.52 (-2.01%) |
57.28 |
56.40 - 57.40 |
1.1304 times |
Fri 21 November 2025 |
57.68 (3.76%) |
55.97 |
55.71 - 58.63 |
1.4179 times |
Thu 20 November 2025 |
55.59 (-0.82%) |
56.12 |
55.47 - 56.84 |
0.9025 times |
Wed 19 November 2025 |
56.05 (-0.23%) |
55.90 |
55.08 - 56.14 |
0.9107 times |
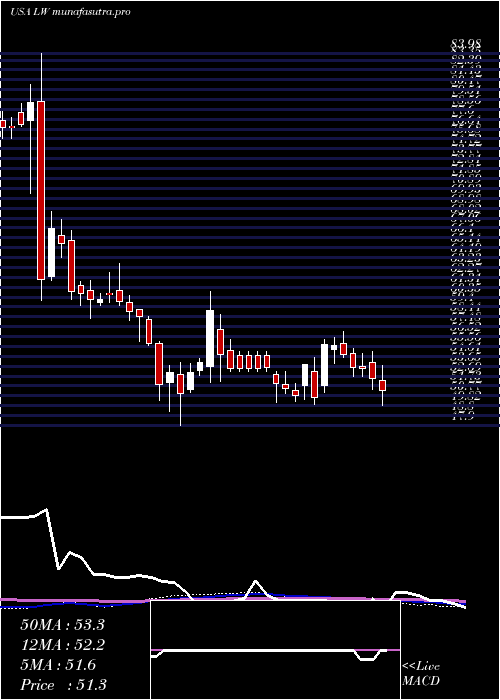
Weekly price and charts LambWeston Strong weekly Stock price targets for LambWeston LW are 59.15 and 61.62 | Weekly Target 1 | 57.29 | | Weekly Target 2 | 58.53 | | Weekly Target 3 | 59.763333333333 | | Weekly Target 4 | 61 | | Weekly Target 5 | 62.23 |
Weekly price and volumes for Lamb Weston
| Date |
Closing |
Open |
Range |
Volume |
Thu 04 December 2025 |
59.76 (1.19%) |
59.06 |
58.53 - 61.00 |
0.5738 times |
Fri 28 November 2025 |
59.06 (2.39%) |
57.28 |
56.40 - 59.91 |
0.787 times |
Fri 21 November 2025 |
57.68 (1.18%) |
57.34 |
55.08 - 58.63 |
0.9392 times |
Fri 14 November 2025 |
57.01 (-8.67%) |
62.63 |
56.25 - 62.87 |
1.6048 times |
Fri 07 November 2025 |
62.42 (1.12%) |
62.33 |
61.33 - 63.07 |
0.8664 times |
Fri 31 October 2025 |
61.73 (0%) |
61.65 |
60.66 - 61.86 |
0.4311 times |
Fri 31 October 2025 |
61.73 (-7.01%) |
66.76 |
60.66 - 67.07 |
1.3818 times |
Fri 24 October 2025 |
66.38 (2.11%) |
65.57 |
63.54 - 66.66 |
1.4492 times |
Fri 17 October 2025 |
65.01 (2.69%) |
63.67 |
62.51 - 65.21 |
1.2331 times |
Tue 07 October 2025 |
63.31 (0.65%) |
62.95 |
62.35 - 63.57 |
0.7336 times |
Fri 03 October 2025 |
62.90 (13.91%) |
55.98 |
54.93 - 63.75 |
3.001 times |
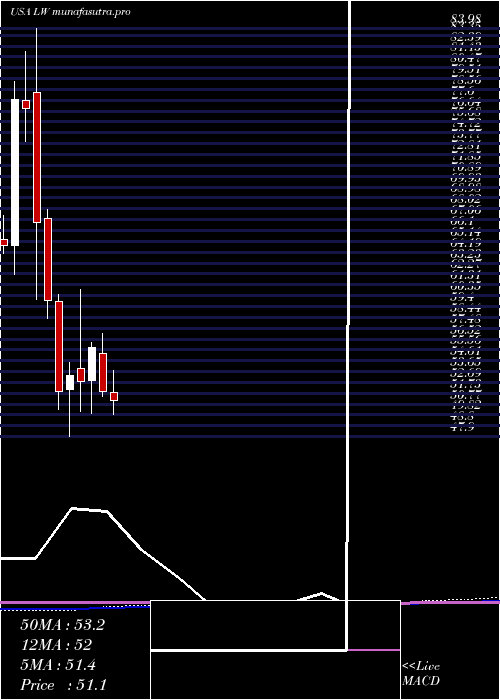
Monthly price and charts LambWeston Strong monthly Stock price targets for LambWeston LW are 59.15 and 61.62 | Monthly Target 1 | 57.29 | | Monthly Target 2 | 58.53 | | Monthly Target 3 | 59.763333333333 | | Monthly Target 4 | 61 | | Monthly Target 5 | 62.23 |
Monthly price and volumes Lamb Weston
| Date |
Closing |
Open |
Range |
Volume |
Thu 04 December 2025 |
59.76 (1.19%) |
59.06 |
58.53 - 61.00 |
0.0978 times |
Fri 28 November 2025 |
59.06 (-4.33%) |
62.33 |
55.08 - 63.07 |
0.715 times |
Fri 31 October 2025 |
61.73 (6.28%) |
58.21 |
58.21 - 67.07 |
1.1218 times |
Tue 30 September 2025 |
58.08 (0.96%) |
57.08 |
52.49 - 60.60 |
1.0245 times |
Fri 29 August 2025 |
57.53 (0.81%) |
56.75 |
50.72 - 57.68 |
0.76 times |
Thu 31 July 2025 |
57.07 (10.07%) |
51.77 |
47.87 - 61.02 |
1.7192 times |
Mon 30 June 2025 |
51.85 (-7.05%) |
55.22 |
51.47 - 56.99 |
0.8447 times |
Fri 30 May 2025 |
55.78 (5.62%) |
52.84 |
49.96 - 56.20 |
0.9942 times |
Wed 30 April 2025 |
52.81 (-0.92%) |
53.93 |
50.16 - 60.92 |
1.4244 times |
Mon 31 March 2025 |
53.30 (2.76%) |
52.03 |
47.90 - 54.43 |
1.2985 times |
Fri 28 February 2025 |
51.87 (-13.46%) |
59.80 |
50.28 - 60.48 |
1.548 times |
DMA SMA EMA moving averages of Lamb Weston LW
DMA (daily moving average) of Lamb Weston LW
| DMA period | DMA value | | 5 day DMA | 59.57 | | 12 day DMA | 58.21 | | 20 day DMA | 58.64 | | 35 day DMA | 61 | | 50 day DMA | 60.52 | | 100 day DMA | 57.78 | | 150 day DMA | 56.19 | | 200 day DMA | 55.52 | EMA (exponential moving average) of Lamb Weston LW
| EMA period | EMA current | EMA prev | EMA prev2 | | 5 day EMA | 59.54 | 59.43 | 58.9 | | 12 day EMA | 59.07 | 58.94 | 58.66 | | 20 day EMA | 59.24 | 59.18 | 59.04 | | 35 day EMA | 59.39 | 59.37 | 59.3 | | 50 day EMA | 60.1 | 60.11 | 60.09 |
SMA (simple moving average) of Lamb Weston LW
| SMA period | SMA current | SMA prev | SMA prev2 | | 5 day SMA | 59.57 | 59.54 | 59.25 | | 12 day SMA | 58.21 | 57.92 | 57.63 | | 20 day SMA | 58.64 | 58.79 | 58.87 | | 35 day SMA | 61 | 61.12 | 61.23 | | 50 day SMA | 60.52 | 60.44 | 60.36 | | 100 day SMA | 57.78 | 57.7 | 57.6 | | 150 day SMA | 56.19 | 56.14 | 56.09 | | 200 day SMA | 55.52 | 55.51 | 55.49 |
|
|
