LasVegas LVS full analysis,charts,indicators,moving averages,SMA,DMA,EMA,ADX,MACD,RSILas Vegas LVS WideScreen charts, DMA,SMA,EMA technical analysis, forecast prediction, by indicators ADX,MACD,RSI,CCI USA stock exchange
operates under Consumer Services sector & deals in Hotels Resorts
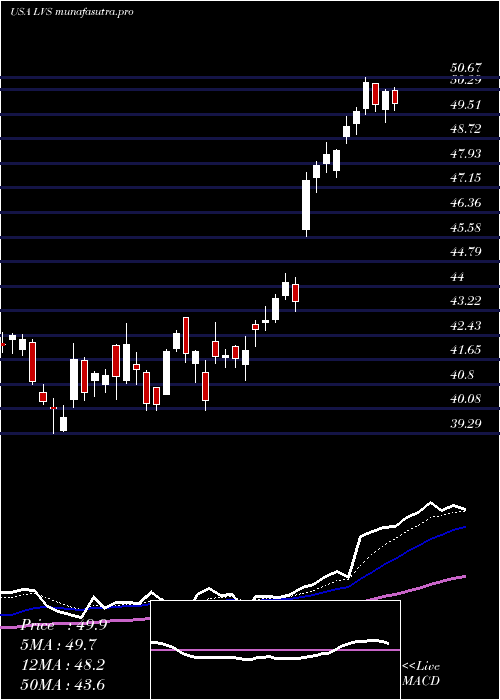
Daily price and charts and targets LasVegas Strong Daily Stock price targets for LasVegas LVS are 64.97 and 66.64 | Daily Target 1 | 64.49 | | Daily Target 2 | 65.45 | | Daily Target 3 | 66.163333333333 | | Daily Target 4 | 67.12 | | Daily Target 5 | 67.83 |
Daily price and volume Las Vegas
| Date |
Closing |
Open |
Range |
Volume |
Thu 04 December 2025 |
66.40 (-0.72%) |
66.77 |
65.21 - 66.88 |
1.422 times |
Wed 03 December 2025 |
66.88 (-2.38%) |
68.66 |
66.87 - 68.99 |
1.5052 times |
Tue 02 December 2025 |
68.51 (-1.41%) |
69.48 |
68.26 - 69.64 |
1.4376 times |
Mon 01 December 2025 |
69.49 (1.95%) |
69.28 |
69.07 - 70.45 |
1.1298 times |
Fri 28 November 2025 |
68.16 (-0.13%) |
67.95 |
67.59 - 68.63 |
0.3279 times |
Wed 26 November 2025 |
68.25 (0.93%) |
67.66 |
67.40 - 68.42 |
0.8241 times |
Tue 25 November 2025 |
67.62 (2.99%) |
66.00 |
65.79 - 68.15 |
0.6268 times |
Mon 24 November 2025 |
65.66 (2.1%) |
64.64 |
64.63 - 65.78 |
0.551 times |
Fri 21 November 2025 |
64.31 (1.31%) |
63.87 |
63.21 - 64.94 |
1.2478 times |
Thu 20 November 2025 |
63.48 (-0.89%) |
64.65 |
63.42 - 65.92 |
0.9279 times |
Wed 19 November 2025 |
64.05 (-1.13%) |
65.02 |
63.89 - 65.42 |
1.3609 times |
Weekly price and charts LasVegas Strong weekly Stock price targets for LasVegas LVS are 63.19 and 68.43 | Weekly Target 1 | 62.11 | | Weekly Target 2 | 64.26 | | Weekly Target 3 | 67.353333333333 | | Weekly Target 4 | 69.5 | | Weekly Target 5 | 72.59 |
Weekly price and volumes for Las Vegas
| Date |
Closing |
Open |
Range |
Volume |
Thu 04 December 2025 |
66.40 (-2.58%) |
69.28 |
65.21 - 70.45 |
1.073 times |
Fri 28 November 2025 |
68.16 (5.99%) |
64.64 |
64.63 - 68.63 |
0.455 times |
Fri 21 November 2025 |
64.31 (-1.64%) |
65.53 |
63.21 - 66.26 |
1.1444 times |
Fri 14 November 2025 |
65.38 (0.26%) |
65.86 |
64.03 - 67.83 |
1.4723 times |
Fri 07 November 2025 |
65.21 (9.87%) |
60.63 |
60.32 - 65.55 |
0.9657 times |
Fri 31 October 2025 |
59.35 (0%) |
58.76 |
58.52 - 59.50 |
0.2187 times |
Fri 31 October 2025 |
59.35 (3.04%) |
58.59 |
57.60 - 59.66 |
1.1307 times |
Fri 24 October 2025 |
57.60 (18.67%) |
49.89 |
49.20 - 58.29 |
1.5395 times |
Fri 17 October 2025 |
48.54 (-6.29%) |
48.50 |
45.91 - 50.11 |
1.6461 times |
Tue 07 October 2025 |
51.80 (1.21%) |
51.76 |
51.13 - 53.11 |
0.3549 times |
Fri 03 October 2025 |
51.18 (-5.24%) |
54.93 |
50.64 - 55.49 |
0.9329 times |

Monthly price and charts LasVegas Strong monthly Stock price targets for LasVegas LVS are 63.19 and 68.43 | Monthly Target 1 | 62.11 | | Monthly Target 2 | 64.26 | | Monthly Target 3 | 67.353333333333 | | Monthly Target 4 | 69.5 | | Monthly Target 5 | 72.59 |
Monthly price and volumes Las Vegas
| Date |
Closing |
Open |
Range |
Volume |
Thu 04 December 2025 |
66.40 (-2.58%) |
69.28 |
65.21 - 70.45 |
0.2306 times |
Fri 28 November 2025 |
68.16 (14.84%) |
60.63 |
60.32 - 68.63 |
0.8676 times |
Fri 31 October 2025 |
59.35 (10.34%) |
53.87 |
45.91 - 59.66 |
1.1681 times |
Tue 30 September 2025 |
53.79 (-6.66%) |
56.87 |
51.55 - 57.42 |
1.1314 times |
Fri 29 August 2025 |
57.63 (9.98%) |
52.01 |
51.51 - 58.05 |
0.7975 times |
Thu 31 July 2025 |
52.40 (20.43%) |
45.80 |
45.60 - 53.58 |
1.1735 times |
Mon 30 June 2025 |
43.51 (5.71%) |
42.09 |
40.03 - 44.41 |
0.8556 times |
Fri 30 May 2025 |
41.16 (12.24%) |
36.78 |
36.60 - 42.60 |
1.2791 times |
Wed 30 April 2025 |
36.67 (-5.07%) |
38.63 |
30.18 - 39.29 |
1.5215 times |
Mon 31 March 2025 |
38.63 (-13.6%) |
46.42 |
37.38 - 47.63 |
0.9751 times |
Fri 28 February 2025 |
44.71 (-2.44%) |
44.48 |
41.15 - 45.73 |
1.1171 times |

DMA SMA EMA moving averages of Las Vegas LVS
DMA (daily moving average) of Las Vegas LVS
| DMA period | DMA value | | 5 day DMA | 67.89 | | 12 day DMA | 66.47 | | 20 day DMA | 66.06 | | 35 day DMA | 61.78 | | 50 day DMA | 58.91 | | 100 day DMA | 56 | | 150 day DMA | 51.32 | | 200 day DMA | 48.38 | EMA (exponential moving average) of Las Vegas LVS
| EMA period | EMA current | EMA prev | EMA prev2 | | 5 day EMA | 67.26 | 67.69 | 68.1 | | 12 day EMA | 66.6 | 66.64 | 66.6 | | 20 day EMA | 65.26 | 65.14 | 64.96 | | 35 day EMA | 62.44 | 62.21 | 61.94 | | 50 day EMA | 59.3 | 59.01 | 58.69 |
SMA (simple moving average) of Las Vegas LVS
| SMA period | SMA current | SMA prev | SMA prev2 | | 5 day SMA | 67.89 | 68.26 | 68.41 | | 12 day SMA | 66.47 | 66.34 | 66.21 | | 20 day SMA | 66.06 | 65.87 | 65.59 | | 35 day SMA | 61.78 | 61.28 | 60.74 | | 50 day SMA | 58.91 | 58.66 | 58.38 | | 100 day SMA | 56 | 55.84 | 55.67 | | 150 day SMA | 51.32 | 51.12 | 50.92 | | 200 day SMA | 48.38 | 48.25 | 48.12 |
|
|
