LululemonAthletica LULU full analysis,charts,indicators,moving averages,SMA,DMA,EMA,ADX,MACD,RSILululemon Athletica LULU WideScreen charts, DMA,SMA,EMA technical analysis, forecast prediction, by indicators ADX,MACD,RSI,CCI USA stock exchange
operates under Consumer Non Durables sector & deals in Apparel
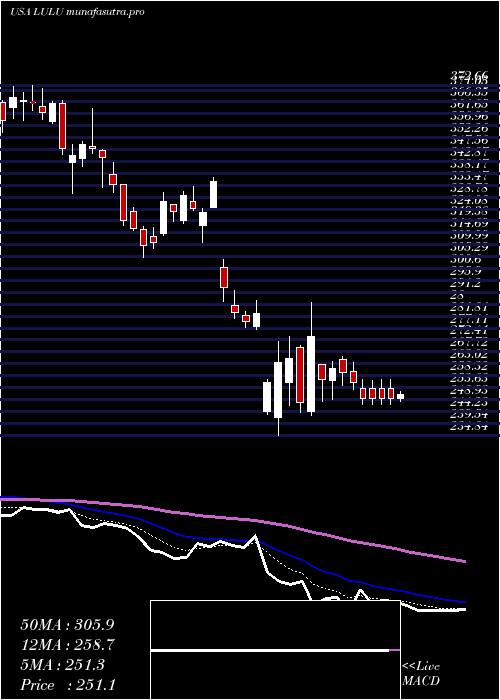
Daily price and charts and targets LululemonAthletica Strong Daily Stock price targets for LululemonAthletica LULU are 181.6 and 186.91 | Daily Target 1 | 177.39 | | Daily Target 2 | 180.49 | | Daily Target 3 | 182.69666666667 | | Daily Target 4 | 185.8 | | Daily Target 5 | 188.01 |
Daily price and volume Lululemon Athletica
| Date |
Closing |
Open |
Range |
Volume |
Thu 04 December 2025 |
183.60 (0.71%) |
182.71 |
179.59 - 184.90 |
0.9971 times |
Wed 03 December 2025 |
182.30 (-0.05%) |
182.66 |
178.90 - 185.07 |
0.9197 times |
Tue 02 December 2025 |
182.40 (-0.01%) |
183.35 |
181.21 - 184.40 |
0.7922 times |
Mon 01 December 2025 |
182.41 (-0.96%) |
181.19 |
180.25 - 184.94 |
1.3934 times |
Fri 28 November 2025 |
184.18 (1.23%) |
184.99 |
183.50 - 186.69 |
1.0132 times |
Wed 26 November 2025 |
181.94 (2.5%) |
178.50 |
177.79 - 183.69 |
0.7086 times |
Tue 25 November 2025 |
177.51 (4.62%) |
169.92 |
169.50 - 179.17 |
0.7866 times |
Mon 24 November 2025 |
169.67 (0.89%) |
168.32 |
166.23 - 172.39 |
1.2954 times |
Fri 21 November 2025 |
168.18 (2.12%) |
165.21 |
163.47 - 170.18 |
1.1173 times |
Thu 20 November 2025 |
164.69 (-0.83%) |
166.13 |
164.51 - 170.50 |
0.9764 times |
Wed 19 November 2025 |
166.06 (1.29%) |
164.67 |
163.45 - 169.10 |
0.8387 times |
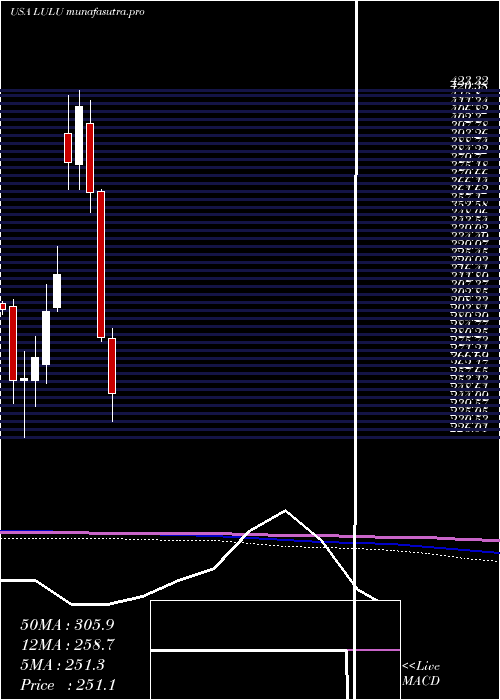
Weekly price and charts LululemonAthletica Strong weekly Stock price targets for LululemonAthletica LULU are 181.25 and 187.42 | Weekly Target 1 | 176.35 | | Weekly Target 2 | 179.98 | | Weekly Target 3 | 182.52333333333 | | Weekly Target 4 | 186.15 | | Weekly Target 5 | 188.69 |
Weekly price and volumes for Lululemon Athletica
| Date |
Closing |
Open |
Range |
Volume |
Thu 04 December 2025 |
183.60 (-0.31%) |
181.19 |
178.90 - 185.07 |
0.9184 times |
Fri 28 November 2025 |
184.18 (9.51%) |
168.32 |
166.23 - 186.69 |
0.8515 times |
Fri 21 November 2025 |
168.18 (-1.46%) |
168.62 |
160.97 - 170.50 |
0.9905 times |
Fri 14 November 2025 |
170.68 (2.74%) |
167.80 |
165.35 - 173.23 |
0.7393 times |
Fri 07 November 2025 |
166.13 (-2.59%) |
164.08 |
160.30 - 169.74 |
0.8173 times |
Fri 31 October 2025 |
170.54 (0%) |
168.40 |
166.57 - 171.46 |
0.2246 times |
Fri 31 October 2025 |
170.54 (-4.25%) |
186.43 |
166.57 - 186.91 |
1.4987 times |
Fri 24 October 2025 |
178.11 (6.24%) |
168.12 |
167.70 - 183.05 |
1.1504 times |
Fri 17 October 2025 |
167.65 (0.08%) |
169.19 |
160.87 - 171.35 |
1.1515 times |
Fri 10 October 2025 |
167.51 (-4.47%) |
175.51 |
166.53 - 178.90 |
1.6577 times |
Fri 03 October 2025 |
175.35 (-0.54%) |
177.72 |
175.00 - 181.57 |
1.093 times |

Monthly price and charts LululemonAthletica Strong monthly Stock price targets for LululemonAthletica LULU are 181.25 and 187.42 | Monthly Target 1 | 176.35 | | Monthly Target 2 | 179.98 | | Monthly Target 3 | 182.52333333333 | | Monthly Target 4 | 186.15 | | Monthly Target 5 | 188.69 |
Monthly price and volumes Lululemon Athletica
| Date |
Closing |
Open |
Range |
Volume |
Thu 04 December 2025 |
183.60 (-0.31%) |
181.19 |
178.90 - 185.07 |
0.1811 times |
Fri 28 November 2025 |
184.18 (8%) |
164.08 |
160.30 - 186.69 |
0.6701 times |
Fri 31 October 2025 |
170.54 (-4.15%) |
178.25 |
160.87 - 186.91 |
1.2335 times |
Tue 30 September 2025 |
177.93 (-12%) |
199.81 |
159.25 - 206.64 |
2.4985 times |
Fri 29 August 2025 |
202.20 (0.83%) |
199.94 |
185.95 - 208.13 |
1.0544 times |
Thu 31 July 2025 |
200.53 (-15.59%) |
237.23 |
200.24 - 252.24 |
1.0046 times |
Mon 30 June 2025 |
237.58 (-24.98%) |
315.13 |
219.97 - 340.25 |
1.3001 times |
Fri 30 May 2025 |
316.67 (16.95%) |
271.34 |
268.36 - 330.49 |
0.5348 times |
Wed 30 April 2025 |
270.77 (-4.34%) |
282.23 |
234.84 - 287.95 |
0.8751 times |
Mon 31 March 2025 |
283.06 (-22.58%) |
365.80 |
280.83 - 367.01 |
0.648 times |
Fri 28 February 2025 |
365.61 (-11.73%) |
404.50 |
354.05 - 417.91 |
0.4256 times |
DMA SMA EMA moving averages of Lululemon Athletica LULU
DMA (daily moving average) of Lululemon Athletica LULU
| DMA period | DMA value | | 5 day DMA | 182.98 | | 12 day DMA | 175.57 | | 20 day DMA | 172.6 | | 35 day DMA | 172.65 | | 50 day DMA | 172.95 | | 100 day DMA | 183.94 | | 150 day DMA | 213.84 | | 200 day DMA | 236.24 | EMA (exponential moving average) of Lululemon Athletica LULU
| EMA period | EMA current | EMA prev | EMA prev2 | | 5 day EMA | 181.87 | 181 | 180.35 | | 12 day EMA | 177.87 | 176.83 | 175.83 | | 20 day EMA | 175.53 | 174.68 | 173.88 | | 35 day EMA | 174.16 | 173.6 | 173.09 | | 50 day EMA | 173.96 | 173.57 | 173.21 |
SMA (simple moving average) of Lululemon Athletica LULU
| SMA period | SMA current | SMA prev | SMA prev2 | | 5 day SMA | 182.98 | 182.65 | 181.69 | | 12 day SMA | 175.57 | 173.95 | 172.99 | | 20 day SMA | 172.6 | 171.8 | 170.72 | | 35 day SMA | 172.65 | 172.17 | 171.8 | | 50 day SMA | 172.95 | 172.87 | 172.69 | | 100 day SMA | 183.94 | 184.33 | 184.8 | | 150 day SMA | 213.84 | 214.43 | 215.02 | | 200 day SMA | 236.24 | 237.15 | 238.2 |
|
|
