LtcProperties LTC full analysis,charts,indicators,moving averages,SMA,DMA,EMA,ADX,MACD,RSILtc Properties LTC WideScreen charts, DMA,SMA,EMA technical analysis, forecast prediction, by indicators ADX,MACD,RSI,CCI USA stock exchange
operates under Consumer Services sector & deals in Real Estate Investment Trusts
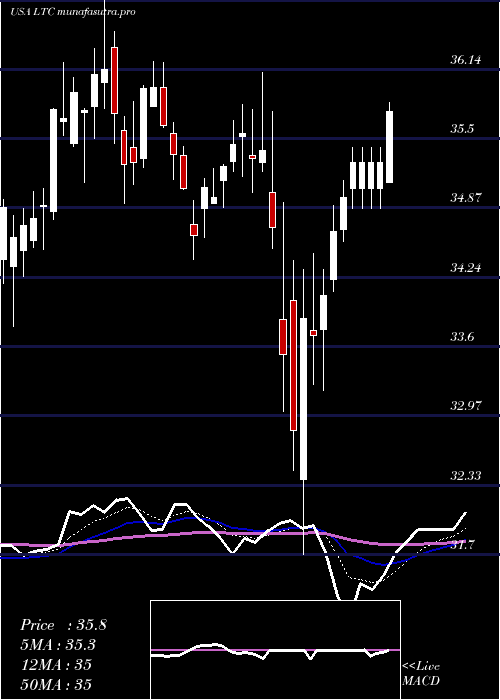
Daily price and charts and targets LtcProperties Strong Daily Stock price targets for LtcProperties LTC are 35.18 and 35.62 | Daily Target 1 | 35.1 | | Daily Target 2 | 35.26 | | Daily Target 3 | 35.536666666667 | | Daily Target 4 | 35.7 | | Daily Target 5 | 35.98 |
Daily price and volume Ltc Properties
| Date |
Closing |
Open |
Range |
Volume |
Thu 04 December 2025 |
35.43 (-0.59%) |
35.55 |
35.37 - 35.81 |
0.7785 times |
Wed 03 December 2025 |
35.64 (-0.67%) |
36.02 |
35.42 - 36.02 |
0.846 times |
Tue 02 December 2025 |
35.88 (-0.42%) |
36.05 |
35.64 - 36.36 |
0.4722 times |
Mon 01 December 2025 |
36.03 (-1.26%) |
36.24 |
35.93 - 36.46 |
0.8329 times |
Fri 28 November 2025 |
36.49 (-0.27%) |
36.66 |
36.25 - 36.75 |
0.5769 times |
Wed 26 November 2025 |
36.59 (0.25%) |
36.48 |
36.48 - 36.92 |
1.4175 times |
Tue 25 November 2025 |
36.50 (1.5%) |
36.13 |
35.95 - 36.81 |
1.6715 times |
Mon 24 November 2025 |
35.96 (-0.03%) |
36.00 |
35.75 - 36.33 |
1.0239 times |
Fri 21 November 2025 |
35.97 (0.64%) |
35.76 |
35.50 - 36.18 |
1.2775 times |
Thu 20 November 2025 |
35.74 (-0.22%) |
35.77 |
35.53 - 35.96 |
1.103 times |
Wed 19 November 2025 |
35.82 (-1.76%) |
36.25 |
35.73 - 36.55 |
1.502 times |
Weekly price and charts LtcProperties Strong weekly Stock price targets for LtcProperties LTC are 34.86 and 35.95 | Weekly Target 1 | 34.66 | | Weekly Target 2 | 35.05 | | Weekly Target 3 | 35.753333333333 | | Weekly Target 4 | 36.14 | | Weekly Target 5 | 36.84 |
Weekly price and volumes for Ltc Properties
| Date |
Closing |
Open |
Range |
Volume |
Thu 04 December 2025 |
35.43 (-2.9%) |
36.24 |
35.37 - 36.46 |
0.7883 times |
Fri 28 November 2025 |
36.49 (1.45%) |
36.00 |
35.75 - 36.92 |
1.2619 times |
Fri 21 November 2025 |
35.97 (-0.28%) |
36.15 |
35.50 - 36.62 |
1.4754 times |
Fri 14 November 2025 |
36.07 (0.53%) |
36.06 |
35.54 - 36.50 |
1.2728 times |
Fri 07 November 2025 |
35.88 (2.28%) |
35.74 |
34.94 - 36.45 |
1.1958 times |
Fri 31 October 2025 |
35.08 (0%) |
34.98 |
34.66 - 35.54 |
0.2709 times |
Fri 31 October 2025 |
35.08 (-0.74%) |
35.44 |
34.45 - 35.72 |
1.2623 times |
Fri 24 October 2025 |
35.34 (0.34%) |
35.31 |
34.92 - 35.62 |
1.0049 times |
Fri 17 October 2025 |
35.22 (0.86%) |
34.20 |
33.77 - 35.24 |
1.0728 times |
Tue 07 October 2025 |
34.92 (-3%) |
36.00 |
34.48 - 36.15 |
0.395 times |
Fri 03 October 2025 |
36.00 (-1.67%) |
36.49 |
36.00 - 37.25 |
1.2386 times |

Monthly price and charts LtcProperties Strong monthly Stock price targets for LtcProperties LTC are 34.86 and 35.95 | Monthly Target 1 | 34.66 | | Monthly Target 2 | 35.05 | | Monthly Target 3 | 35.753333333333 | | Monthly Target 4 | 36.14 | | Monthly Target 5 | 36.84 |
Monthly price and volumes Ltc Properties
| Date |
Closing |
Open |
Range |
Volume |
Thu 04 December 2025 |
35.43 (-2.9%) |
36.24 |
35.37 - 36.46 |
0.178 times |
Fri 28 November 2025 |
36.49 (4.02%) |
35.74 |
34.94 - 36.92 |
1.1754 times |
Fri 31 October 2025 |
35.08 (-4.83%) |
36.84 |
33.77 - 37.25 |
1.0362 times |
Tue 30 September 2025 |
36.86 (0.99%) |
36.45 |
35.10 - 37.05 |
1.2153 times |
Fri 29 August 2025 |
36.50 (7.23%) |
34.56 |
33.89 - 37.19 |
1.1791 times |
Thu 31 July 2025 |
34.04 (-1.65%) |
34.87 |
33.95 - 35.84 |
1.2503 times |
Mon 30 June 2025 |
34.61 (-2.2%) |
35.25 |
34.20 - 35.76 |
0.9089 times |
Fri 30 May 2025 |
35.39 (-1.34%) |
35.68 |
34.11 - 36.99 |
1.0637 times |
Wed 30 April 2025 |
35.87 (1.18%) |
35.52 |
31.70 - 36.22 |
0.9539 times |
Mon 31 March 2025 |
35.45 (1.61%) |
34.84 |
34.40 - 36.77 |
1.0392 times |
Fri 28 February 2025 |
34.89 (1.42%) |
34.15 |
33.36 - 35.12 |
1.0178 times |

DMA SMA EMA moving averages of Ltc Properties LTC
DMA (daily moving average) of Ltc Properties LTC
| DMA period | DMA value | | 5 day DMA | 35.89 | | 12 day DMA | 36.04 | | 20 day DMA | 36 | | 35 day DMA | 35.66 | | 50 day DMA | 35.67 | | 100 day DMA | 35.7 | | 150 day DMA | 35.56 | | 200 day DMA | 35.45 | EMA (exponential moving average) of Ltc Properties LTC
| EMA period | EMA current | EMA prev | EMA prev2 | | 5 day EMA | 35.78 | 35.96 | 36.12 | | 12 day EMA | 35.91 | 36 | 36.07 | | 20 day EMA | 35.9 | 35.95 | 35.98 | | 35 day EMA | 35.84 | 35.86 | 35.87 | | 50 day EMA | 35.7 | 35.71 | 35.71 |
SMA (simple moving average) of Ltc Properties LTC
| SMA period | SMA current | SMA prev | SMA prev2 | | 5 day SMA | 35.89 | 36.13 | 36.3 | | 12 day SMA | 36.04 | 36.1 | 36.13 | | 20 day SMA | 36 | 36.01 | 36.01 | | 35 day SMA | 35.66 | 35.64 | 35.6 | | 50 day SMA | 35.67 | 35.67 | 35.68 | | 100 day SMA | 35.7 | 35.69 | 35.69 | | 150 day SMA | 35.56 | 35.56 | 35.56 | | 200 day SMA | 35.45 | 35.44 | 35.43 |
|
|
