LightbridgeCorporation LTBR full analysis,charts,indicators,moving averages,SMA,DMA,EMA,ADX,MACD,RSILightbridge Corporation LTBR WideScreen charts, DMA,SMA,EMA technical analysis, forecast prediction, by indicators ADX,MACD,RSI,CCI USA stock exchange
operates under Consumer Services sector & deals in Professional Services
Daily price and charts and targets LightbridgeCorporation Strong Daily Stock price targets for LightbridgeCorporation LTBR are 16.9 and 18.84 | Daily Target 1 | 15.31 | | Daily Target 2 | 16.54 | | Daily Target 3 | 17.246666666667 | | Daily Target 4 | 18.48 | | Daily Target 5 | 19.19 |
Daily price and volume Lightbridge Corporation
| Date |
Closing |
Open |
Range |
Volume |
Thu 04 December 2025 |
17.78 (9.55%) |
16.20 |
16.01 - 17.95 |
0.6638 times |
Wed 03 December 2025 |
16.23 (3.24%) |
15.70 |
15.30 - 16.30 |
0.7359 times |
Tue 02 December 2025 |
15.72 (3.63%) |
15.23 |
15.17 - 16.39 |
1.0655 times |
Mon 01 December 2025 |
15.17 (-6.7%) |
15.67 |
15.14 - 16.04 |
0.8729 times |
Fri 28 November 2025 |
16.26 (7.19%) |
15.31 |
15.30 - 16.48 |
0.6261 times |
Wed 26 November 2025 |
15.17 (0.53%) |
15.15 |
14.95 - 15.50 |
0.5156 times |
Tue 25 November 2025 |
15.09 (0.87%) |
14.71 |
14.25 - 15.26 |
0.7709 times |
Mon 24 November 2025 |
14.96 (6.7%) |
14.02 |
13.71 - 15.12 |
0.8338 times |
Fri 21 November 2025 |
14.02 (-3.51%) |
14.50 |
13.29 - 14.59 |
1.8153 times |
Thu 20 November 2025 |
14.53 (-14.78%) |
17.56 |
14.43 - 17.80 |
2.1003 times |
Wed 19 November 2025 |
17.05 (0.71%) |
17.10 |
16.79 - 17.77 |
0.9742 times |
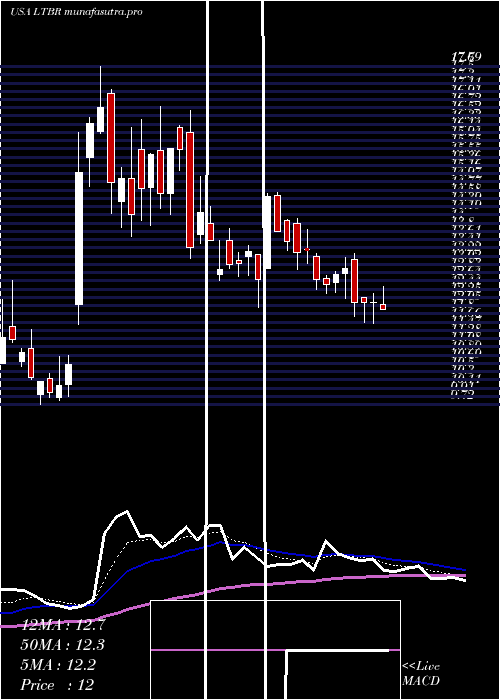
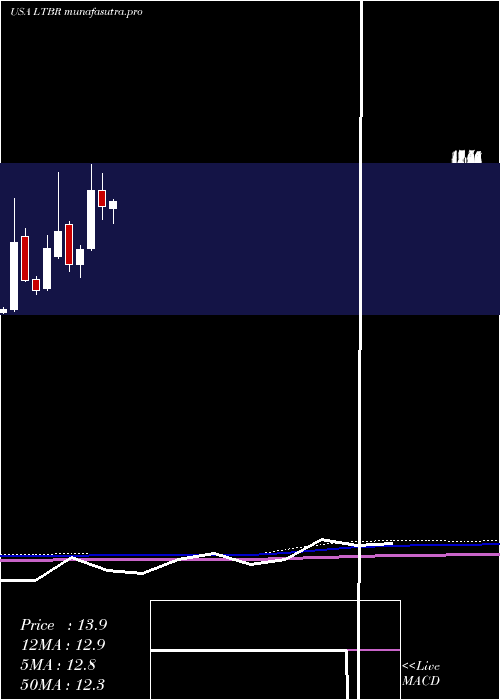
Weekly price and charts LightbridgeCorporation Strong weekly Stock price targets for LightbridgeCorporation LTBR are 16.46 and 19.27 | Weekly Target 1 | 14.15 | | Weekly Target 2 | 15.96 | | Weekly Target 3 | 16.956666666667 | | Weekly Target 4 | 18.77 | | Weekly Target 5 | 19.77 |
Weekly price and volumes for Lightbridge Corporation
| Date |
Closing |
Open |
Range |
Volume |
Thu 04 December 2025 |
17.78 (9.35%) |
15.67 |
15.14 - 17.95 |
0.4858 times |
Fri 28 November 2025 |
16.26 (15.98%) |
14.02 |
13.71 - 16.48 |
0.3997 times |
Fri 21 November 2025 |
14.02 (-21.5%) |
17.57 |
13.29 - 17.80 |
1.005 times |
Fri 14 November 2025 |
17.86 (-4.75%) |
20.31 |
16.80 - 20.99 |
0.7741 times |
Fri 07 November 2025 |
18.75 (-30.12%) |
23.02 |
16.58 - 23.80 |
0.9824 times |
Fri 31 October 2025 |
26.83 (0%) |
27.72 |
25.88 - 28.44 |
0.2149 times |
Fri 31 October 2025 |
26.83 (6.01%) |
26.00 |
23.35 - 28.44 |
1.0523 times |
Fri 24 October 2025 |
25.31 (6.21%) |
24.70 |
20.34 - 26.65 |
1.1884 times |
Fri 17 October 2025 |
23.83 (7.93%) |
22.79 |
22.79 - 31.34 |
2.0898 times |
Fri 10 October 2025 |
22.08 (2.75%) |
21.65 |
21.40 - 25.98 |
1.8075 times |
Fri 03 October 2025 |
21.49 (0.23%) |
22.62 |
19.73 - 23.37 |
1.7459 times |
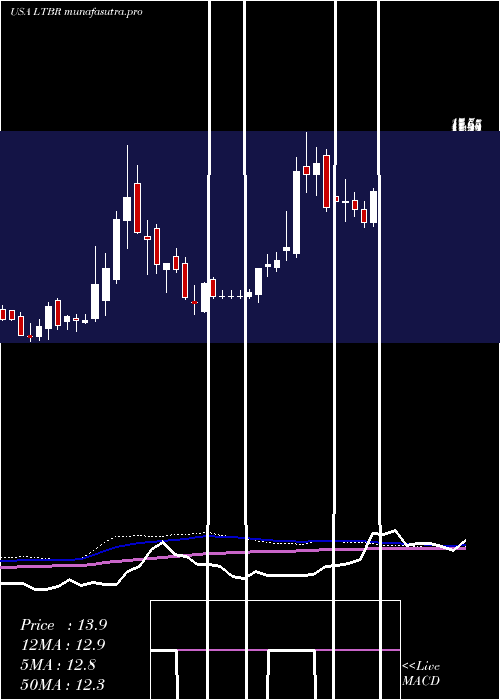
Monthly price and charts LightbridgeCorporation Strong monthly Stock price targets for LightbridgeCorporation LTBR are 16.46 and 19.27 | Monthly Target 1 | 14.15 | | Monthly Target 2 | 15.96 | | Monthly Target 3 | 16.956666666667 | | Monthly Target 4 | 18.77 | | Monthly Target 5 | 19.77 |
Monthly price and volumes Lightbridge Corporation
| Date |
Closing |
Open |
Range |
Volume |
Thu 04 December 2025 |
17.78 (9.35%) |
15.67 |
15.14 - 17.95 |
0.1095 times |
Fri 28 November 2025 |
16.26 (-39.4%) |
23.02 |
13.29 - 23.80 |
0.7125 times |
Fri 31 October 2025 |
26.83 (26.5%) |
20.88 |
19.73 - 31.34 |
1.6347 times |
Tue 30 September 2025 |
21.21 (40.19%) |
14.59 |
13.59 - 23.37 |
1.4662 times |
Fri 29 August 2025 |
15.13 (12.24%) |
12.95 |
12.52 - 18.80 |
0.9479 times |
Thu 31 July 2025 |
13.48 (0.82%) |
13.21 |
11.64 - 15.67 |
0.9997 times |
Mon 30 June 2025 |
13.37 (-11.16%) |
15.06 |
12.01 - 16.74 |
1.1873 times |
Fri 30 May 2025 |
15.05 (67.97%) |
9.13 |
8.85 - 17.70 |
1.5241 times |
Wed 30 April 2025 |
8.96 (20.11%) |
7.48 |
6.10 - 9.35 |
0.5525 times |
Mon 31 March 2025 |
7.46 (-31.24%) |
11.55 |
6.72 - 11.86 |
0.8657 times |
Fri 28 February 2025 |
10.85 (19.89%) |
8.29 |
8.05 - 16.90 |
2.2338 times |
DMA SMA EMA moving averages of Lightbridge Corporation LTBR
DMA (daily moving average) of Lightbridge Corporation LTBR
| DMA period | DMA value | | 5 day DMA | 16.23 | | 12 day DMA | 15.74 | | 20 day DMA | 16.97 | | 35 day DMA | 20.29 | | 50 day DMA | 21.06 | | 100 day DMA | 18.05 | | 150 day DMA | 16.25 | | 200 day DMA | 14.36 | EMA (exponential moving average) of Lightbridge Corporation LTBR
| EMA period | EMA current | EMA prev | EMA prev2 | | 5 day EMA | 16.45 | 15.78 | 15.55 | | 12 day EMA | 16.54 | 16.32 | 16.34 | | 20 day EMA | 17.45 | 17.41 | 17.53 | | 35 day EMA | 18.65 | 18.7 | 18.85 | | 50 day EMA | 20.38 | 20.49 | 20.66 |
SMA (simple moving average) of Lightbridge Corporation LTBR
| SMA period | SMA current | SMA prev | SMA prev2 | | 5 day SMA | 16.23 | 15.71 | 15.48 | | 12 day SMA | 15.74 | 15.68 | 15.82 | | 20 day SMA | 16.97 | 17.23 | 17.55 | | 35 day SMA | 20.29 | 20.56 | 20.83 | | 50 day SMA | 21.06 | 21.07 | 21.17 | | 100 day SMA | 18.05 | 18.01 | 17.99 | | 150 day SMA | 16.25 | 16.19 | 16.15 | | 200 day SMA | 14.36 | 14.34 | 14.33 |
|
|
