LatticeSemiconductor LSCC full analysis,charts,indicators,moving averages,SMA,DMA,EMA,ADX,MACD,RSILattice Semiconductor LSCC WideScreen charts, DMA,SMA,EMA technical analysis, forecast prediction, by indicators ADX,MACD,RSI,CCI USA stock exchange
operates under Technology sector & deals in Semiconductors
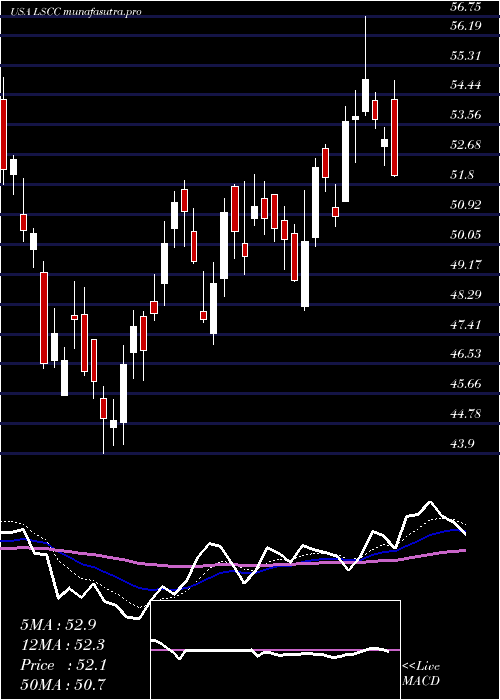
Daily price and charts and targets LatticeSemiconductor Strong Daily Stock price targets for LatticeSemiconductor LSCC are 74.94 and 77.43 | Daily Target 1 | 72.98 | | Daily Target 2 | 74.4 | | Daily Target 3 | 75.466666666667 | | Daily Target 4 | 76.89 | | Daily Target 5 | 77.96 |
Daily price and volume Lattice Semiconductor
| Date |
Closing |
Open |
Range |
Volume |
Thu 04 December 2025 |
75.83 (0.93%) |
74.82 |
74.04 - 76.53 |
0.9516 times |
Wed 03 December 2025 |
75.13 (5.21%) |
71.60 |
70.21 - 75.80 |
1.4227 times |
Tue 02 December 2025 |
71.41 (4.08%) |
69.54 |
69.23 - 73.10 |
1.302 times |
Mon 01 December 2025 |
68.61 (-2.28%) |
69.54 |
68.52 - 69.90 |
1.0604 times |
Fri 28 November 2025 |
70.21 (0.27%) |
69.99 |
69.24 - 70.30 |
0.3079 times |
Wed 26 November 2025 |
70.02 (3.02%) |
68.51 |
68.20 - 71.10 |
0.8671 times |
Tue 25 November 2025 |
67.97 (-0.73%) |
67.58 |
65.53 - 68.30 |
0.9413 times |
Mon 24 November 2025 |
68.47 (1.8%) |
67.17 |
66.69 - 68.65 |
1.0423 times |
Fri 21 November 2025 |
67.26 (5.21%) |
63.32 |
62.68 - 67.77 |
0.9634 times |
Thu 20 November 2025 |
63.93 (-2.1%) |
67.11 |
63.60 - 67.82 |
1.1414 times |
Wed 19 November 2025 |
65.30 (0.93%) |
64.75 |
64.75 - 67.27 |
0.9806 times |
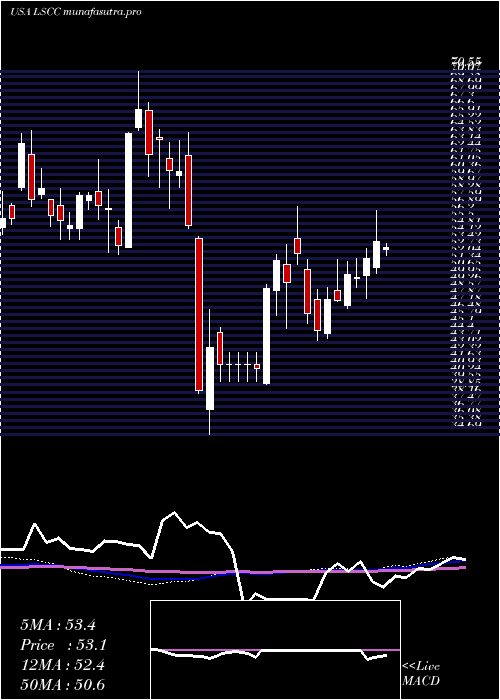
Weekly price and charts LatticeSemiconductor Strong weekly Stock price targets for LatticeSemiconductor LSCC are 72.18 and 80.19 | Weekly Target 1 | 65.62 | | Weekly Target 2 | 70.72 | | Weekly Target 3 | 73.626666666667 | | Weekly Target 4 | 78.73 | | Weekly Target 5 | 81.64 |
Weekly price and volumes for Lattice Semiconductor
| Date |
Closing |
Open |
Range |
Volume |
Thu 04 December 2025 |
75.83 (8%) |
69.54 |
68.52 - 76.53 |
1.1483 times |
Fri 28 November 2025 |
70.21 (4.39%) |
67.17 |
65.53 - 71.10 |
0.7657 times |
Fri 21 November 2025 |
67.26 (4.8%) |
63.37 |
60.50 - 67.82 |
1.2959 times |
Fri 14 November 2025 |
64.18 (1.09%) |
65.67 |
61.96 - 68.89 |
1.4168 times |
Fri 07 November 2025 |
63.49 (-12.98%) |
67.95 |
60.88 - 69.85 |
1.1681 times |
Fri 31 October 2025 |
72.96 (0%) |
73.71 |
71.88 - 74.58 |
0.301 times |
Fri 31 October 2025 |
72.96 (5.51%) |
70.98 |
70.65 - 76.06 |
1.3247 times |
Fri 24 October 2025 |
69.15 (-1.44%) |
70.28 |
65.85 - 73.54 |
0.7961 times |
Fri 17 October 2025 |
70.16 (1.28%) |
71.96 |
69.00 - 73.76 |
0.9286 times |
Fri 10 October 2025 |
69.27 (-4.73%) |
74.70 |
69.13 - 76.15 |
0.8547 times |
Fri 03 October 2025 |
72.71 (1.91%) |
72.31 |
70.54 - 75.00 |
0.9096 times |
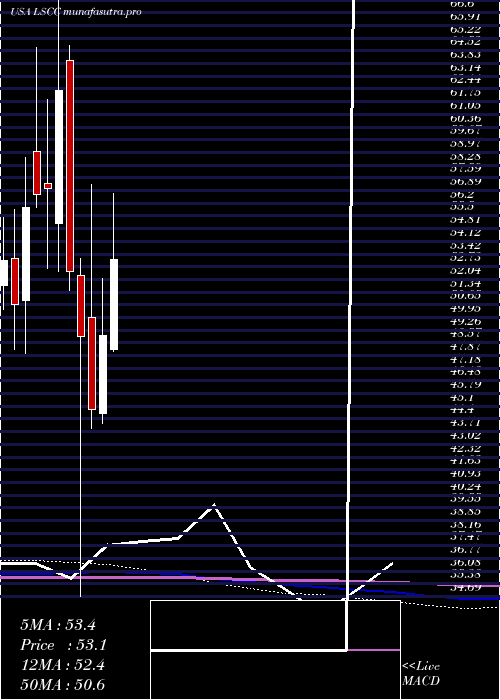
Monthly price and charts LatticeSemiconductor Strong monthly Stock price targets for LatticeSemiconductor LSCC are 72.18 and 80.19 | Monthly Target 1 | 65.62 | | Monthly Target 2 | 70.72 | | Monthly Target 3 | 73.626666666667 | | Monthly Target 4 | 78.73 | | Monthly Target 5 | 81.64 |
Monthly price and volumes Lattice Semiconductor
| Date |
Closing |
Open |
Range |
Volume |
Thu 04 December 2025 |
75.83 (8%) |
69.54 |
68.52 - 76.53 |
0.1956 times |
Fri 28 November 2025 |
70.21 (-3.77%) |
67.95 |
60.50 - 71.10 |
0.7914 times |
Fri 31 October 2025 |
72.96 (-0.49%) |
72.60 |
65.85 - 76.15 |
0.8008 times |
Tue 30 September 2025 |
73.32 (10.45%) |
64.62 |
64.02 - 76.61 |
1.2299 times |
Fri 29 August 2025 |
66.38 (33.21%) |
48.82 |
46.43 - 67.00 |
1.3206 times |
Thu 31 July 2025 |
49.83 (1.71%) |
48.23 |
48.10 - 56.75 |
0.8838 times |
Mon 30 June 2025 |
48.99 (9.01%) |
44.68 |
44.15 - 52.09 |
0.8822 times |
Fri 30 May 2025 |
44.94 (-8.15%) |
49.93 |
43.90 - 57.23 |
1.2896 times |
Wed 30 April 2025 |
48.93 (-6.71%) |
52.23 |
34.69 - 53.18 |
1.7592 times |
Mon 31 March 2025 |
52.45 (-15.86%) |
64.02 |
51.43 - 64.84 |
0.8469 times |
Fri 28 February 2025 |
62.34 (9.33%) |
55.11 |
52.44 - 70.55 |
1.1771 times |
DMA SMA EMA moving averages of Lattice Semiconductor LSCC
DMA (daily moving average) of Lattice Semiconductor LSCC
| DMA period | DMA value | | 5 day DMA | 72.24 | | 12 day DMA | 69.07 | | 20 day DMA | 67.2 | | 35 day DMA | 68.38 | | 50 day DMA | 69.57 | | 100 day DMA | 65.75 | | 150 day DMA | 60.56 | | 200 day DMA | 58.76 | EMA (exponential moving average) of Lattice Semiconductor LSCC
| EMA period | EMA current | EMA prev | EMA prev2 | | 5 day EMA | 72.9 | 71.43 | 69.58 | | 12 day EMA | 70.25 | 69.23 | 68.16 | | 20 day EMA | 69.24 | 68.55 | 67.86 | | 35 day EMA | 69.29 | 68.9 | 68.53 | | 50 day EMA | 70.14 | 69.91 | 69.7 |
SMA (simple moving average) of Lattice Semiconductor LSCC
| SMA period | SMA current | SMA prev | SMA prev2 | | 5 day SMA | 72.24 | 71.08 | 69.64 | | 12 day SMA | 69.07 | 67.9 | 66.98 | | 20 day SMA | 67.2 | 66.57 | 65.97 | | 35 day SMA | 68.38 | 68.25 | 68.14 | | 50 day SMA | 69.57 | 69.5 | 69.48 | | 100 day SMA | 65.75 | 65.52 | 65.3 | | 150 day SMA | 60.56 | 60.38 | 60.2 | | 200 day SMA | 58.76 | 58.72 | 58.66 |
|
|
