LiquidityServices LQDT full analysis,charts,indicators,moving averages,SMA,DMA,EMA,ADX,MACD,RSILiquidity Services LQDT WideScreen charts, DMA,SMA,EMA technical analysis, forecast prediction, by indicators ADX,MACD,RSI,CCI USA stock exchange
operates under Miscellaneous sector & deals in Business Services
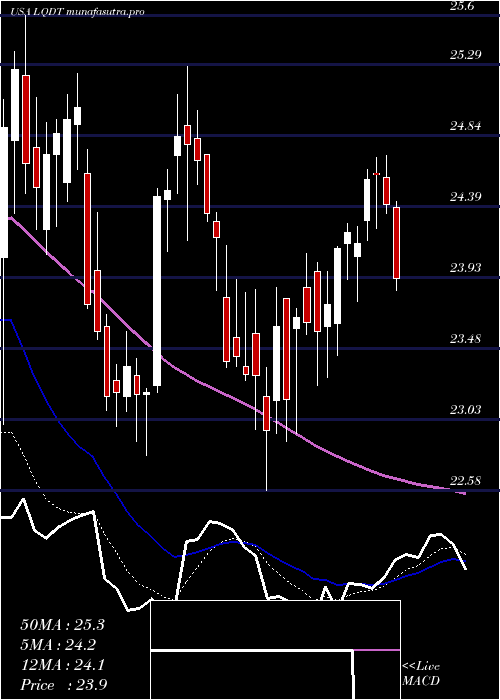
Daily price and charts and targets LiquidityServices Strong Daily Stock price targets for LiquidityServices LQDT are 29.53 and 30.08 | Daily Target 1 | 29.41 | | Daily Target 2 | 29.65 | | Daily Target 3 | 29.96 | | Daily Target 4 | 30.2 | | Daily Target 5 | 30.51 |
Daily price and volume Liquidity Services
| Date |
Closing |
Open |
Range |
Volume |
Thu 04 December 2025 |
29.89 (-0.93%) |
30.27 |
29.72 - 30.27 |
0.5309 times |
Wed 03 December 2025 |
30.17 (2.55%) |
29.57 |
29.55 - 30.34 |
0.608 times |
Tue 02 December 2025 |
29.42 (-1.41%) |
29.81 |
29.37 - 30.00 |
0.4336 times |
Mon 01 December 2025 |
29.84 (-0.67%) |
29.75 |
29.58 - 30.37 |
0.6768 times |
Fri 28 November 2025 |
30.04 (-0.56%) |
30.11 |
29.57 - 30.35 |
0.3742 times |
Wed 26 November 2025 |
30.21 (-0.2%) |
30.12 |
30.03 - 30.36 |
0.9204 times |
Tue 25 November 2025 |
30.27 (5.18%) |
28.75 |
28.42 - 30.35 |
1.1886 times |
Mon 24 November 2025 |
28.78 (2.93%) |
27.91 |
27.80 - 28.92 |
1.3978 times |
Fri 21 November 2025 |
27.96 (8.75%) |
25.76 |
25.76 - 27.96 |
1.6348 times |
Thu 20 November 2025 |
25.71 (13.36%) |
25.45 |
25.08 - 27.64 |
2.2348 times |
Wed 19 November 2025 |
22.68 (0.44%) |
22.55 |
22.42 - 22.89 |
0.5761 times |
Weekly price and charts LiquidityServices Strong weekly Stock price targets for LiquidityServices LQDT are 29.63 and 30.63 | Weekly Target 1 | 28.88 | | Weekly Target 2 | 29.38 | | Weekly Target 3 | 29.876666666667 | | Weekly Target 4 | 30.38 | | Weekly Target 5 | 30.88 |
Weekly price and volumes for Liquidity Services
| Date |
Closing |
Open |
Range |
Volume |
Thu 04 December 2025 |
29.89 (-0.5%) |
29.75 |
29.37 - 30.37 |
0.7789 times |
Fri 28 November 2025 |
30.04 (7.44%) |
27.91 |
27.80 - 30.36 |
1.3439 times |
Fri 21 November 2025 |
27.96 (20.62%) |
23.03 |
22.10 - 27.96 |
2.0851 times |
Fri 14 November 2025 |
23.18 (2.25%) |
22.79 |
22.41 - 24.04 |
1.078 times |
Fri 07 November 2025 |
22.67 (-5.3%) |
23.46 |
21.67 - 23.74 |
0.8425 times |
Fri 31 October 2025 |
23.94 (0%) |
23.65 |
23.51 - 23.95 |
0.158 times |
Fri 31 October 2025 |
23.94 (-3.55%) |
24.91 |
23.24 - 25.01 |
0.7083 times |
Fri 24 October 2025 |
24.82 (6.94%) |
23.29 |
23.29 - 25.02 |
0.799 times |
Fri 17 October 2025 |
23.21 (0.09%) |
23.46 |
22.80 - 24.41 |
1.0116 times |
Fri 10 October 2025 |
23.19 (-15.73%) |
27.52 |
23.12 - 27.64 |
1.1947 times |
Fri 03 October 2025 |
27.52 (0.81%) |
27.44 |
26.92 - 27.88 |
0.8129 times |
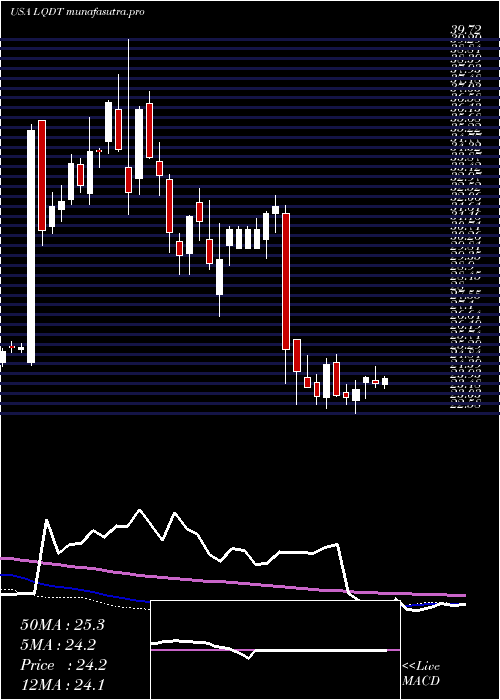
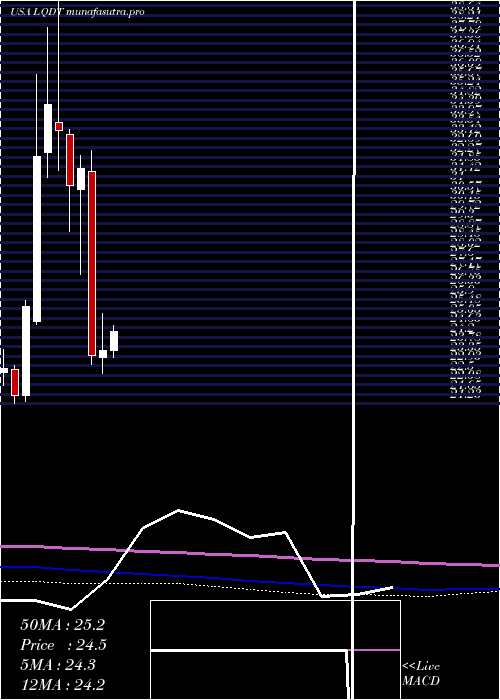
Monthly price and charts LiquidityServices Strong monthly Stock price targets for LiquidityServices LQDT are 29.63 and 30.63 | Monthly Target 1 | 28.88 | | Monthly Target 2 | 29.38 | | Monthly Target 3 | 29.876666666667 | | Monthly Target 4 | 30.38 | | Monthly Target 5 | 30.88 |
Monthly price and volumes Liquidity Services
| Date |
Closing |
Open |
Range |
Volume |
Thu 04 December 2025 |
29.89 (-0.5%) |
29.75 |
29.37 - 30.37 |
0.1252 times |
Fri 28 November 2025 |
30.04 (25.48%) |
23.46 |
21.67 - 30.36 |
0.8596 times |
Fri 31 October 2025 |
23.94 (-12.72%) |
27.16 |
22.80 - 27.88 |
0.7013 times |
Tue 30 September 2025 |
27.43 (3.16%) |
26.28 |
25.80 - 28.72 |
0.7783 times |
Fri 29 August 2025 |
26.59 (11.35%) |
23.58 |
22.30 - 27.55 |
1.2222 times |
Thu 31 July 2025 |
23.88 (1.23%) |
23.62 |
23.30 - 26.30 |
1.1057 times |
Mon 30 June 2025 |
23.59 (0.94%) |
23.31 |
22.58 - 25.28 |
1.0918 times |
Fri 30 May 2025 |
23.37 (-26.46%) |
31.63 |
22.99 - 32.58 |
1.7327 times |
Wed 30 April 2025 |
31.78 (2.48%) |
30.84 |
27.00 - 32.33 |
1.1564 times |
Mon 31 March 2025 |
31.01 (-7.38%) |
33.31 |
28.93 - 33.50 |
1.2269 times |
Fri 28 February 2025 |
33.48 (-3.38%) |
33.82 |
31.67 - 39.72 |
1.5834 times |
DMA SMA EMA moving averages of Liquidity Services LQDT
DMA (daily moving average) of Liquidity Services LQDT
| DMA period | DMA value | | 5 day DMA | 29.87 | | 12 day DMA | 28.13 | | 20 day DMA | 26.1 | | 35 day DMA | 25.14 | | 50 day DMA | 25.34 | | 100 day DMA | 25.64 | | 150 day DMA | 25.41 | | 200 day DMA | 26.89 | EMA (exponential moving average) of Liquidity Services LQDT
| EMA period | EMA current | EMA prev | EMA prev2 | | 5 day EMA | 29.71 | 29.62 | 29.34 | | 12 day EMA | 28.38 | 28.1 | 27.72 | | 20 day EMA | 27.27 | 26.99 | 26.66 | | 35 day EMA | 26.49 | 26.29 | 26.06 | | 50 day EMA | 25.99 | 25.83 | 25.65 |
SMA (simple moving average) of Liquidity Services LQDT
| SMA period | SMA current | SMA prev | SMA prev2 | | 5 day SMA | 29.87 | 29.94 | 29.96 | | 12 day SMA | 28.13 | 27.49 | 26.91 | | 20 day SMA | 26.1 | 25.78 | 25.43 | | 35 day SMA | 25.14 | 24.96 | 24.79 | | 50 day SMA | 25.34 | 25.29 | 25.24 | | 100 day SMA | 25.64 | 25.58 | 25.52 | | 150 day SMA | 25.41 | 25.42 | 25.43 | | 200 day SMA | 26.89 | 26.92 | 26.95 |
|
|
