LiquidiaTechnologies LQDA full analysis,charts,indicators,moving averages,SMA,DMA,EMA,ADX,MACD,RSILiquidia Technologies LQDA WideScreen charts, DMA,SMA,EMA technical analysis, forecast prediction, by indicators ADX,MACD,RSI,CCI USA stock exchange
operates under Health Care sector & deals in Biotechnology Biological Products No Diagnostic Substances
Daily price and charts and targets LiquidiaTechnologies Strong Daily Stock price targets for LiquidiaTechnologies LQDA are 22.96 and 24.22 | Daily Target 1 | 22.75 | | Daily Target 2 | 23.17 | | Daily Target 3 | 24.01 | | Daily Target 4 | 24.43 | | Daily Target 5 | 25.27 |
Daily price and volume Liquidia Technologies
| Date |
Closing |
Open |
Range |
Volume |
Tue 21 October 2025 |
23.59 (-3.48%) |
24.25 |
23.59 - 24.85 |
0.7528 times |
Mon 20 October 2025 |
24.44 (6.77%) |
22.79 |
22.50 - 24.45 |
0.9485 times |
Fri 17 October 2025 |
22.89 (-1.25%) |
22.50 |
22.14 - 23.23 |
0.6544 times |
Thu 16 October 2025 |
23.18 (0.09%) |
23.30 |
22.92 - 24.65 |
1.7977 times |
Wed 15 October 2025 |
23.16 (1.71%) |
22.94 |
22.75 - 23.47 |
0.8957 times |
Tue 14 October 2025 |
22.77 (-4.21%) |
23.75 |
22.39 - 23.84 |
0.8267 times |
Mon 13 October 2025 |
23.77 (2.5%) |
23.51 |
23.07 - 24.10 |
0.7755 times |
Fri 10 October 2025 |
23.19 (-4.37%) |
24.46 |
22.74 - 24.46 |
0.8808 times |
Thu 09 October 2025 |
24.25 (0.71%) |
24.06 |
23.18 - 24.46 |
1.052 times |
Wed 08 October 2025 |
24.08 (0.21%) |
24.12 |
23.78 - 25.12 |
1.4159 times |
Tue 07 October 2025 |
24.03 (5.12%) |
22.95 |
22.60 - 24.30 |
1.3621 times |
Weekly price and charts LiquidiaTechnologies Strong weekly Stock price targets for LiquidiaTechnologies LQDA are 23.05 and 25.4 | Weekly Target 1 | 21.3 | | Weekly Target 2 | 22.44 | | Weekly Target 3 | 23.646666666667 | | Weekly Target 4 | 24.79 | | Weekly Target 5 | 26 |
Weekly price and volumes for Liquidia Technologies
| Date |
Closing |
Open |
Range |
Volume |
Tue 21 October 2025 |
23.59 (3.06%) |
22.79 |
22.50 - 24.85 |
0.3552 times |
Fri 17 October 2025 |
22.89 (-1.29%) |
23.51 |
22.14 - 24.65 |
1.0335 times |
Fri 10 October 2025 |
23.19 (3.53%) |
22.53 |
22.27 - 25.12 |
1.1996 times |
Fri 03 October 2025 |
22.40 (2.75%) |
21.70 |
21.35 - 23.33 |
1.0545 times |
Fri 26 September 2025 |
21.80 (-8.33%) |
24.00 |
21.15 - 24.61 |
1.9829 times |
Fri 19 September 2025 |
23.78 (-8.5%) |
25.95 |
23.50 - 28.00 |
1.2701 times |
Fri 12 September 2025 |
25.99 (-9.91%) |
28.85 |
25.64 - 28.90 |
0.9712 times |
Fri 05 September 2025 |
28.85 (4.23%) |
29.05 |
27.81 - 29.94 |
0.9273 times |
Fri 29 August 2025 |
27.68 (0%) |
27.39 |
26.86 - 27.78 |
0.2039 times |
Fri 29 August 2025 |
27.68 (3.13%) |
26.95 |
26.06 - 28.82 |
1.0018 times |
Fri 22 August 2025 |
26.84 (3.43%) |
26.25 |
26.00 - 28.00 |
1.1544 times |
Monthly price and charts LiquidiaTechnologies Strong monthly Stock price targets for LiquidiaTechnologies LQDA are 22.47 and 26.24 | Monthly Target 1 | 19.58 | | Monthly Target 2 | 21.59 | | Monthly Target 3 | 23.353333333333 | | Monthly Target 4 | 25.36 | | Monthly Target 5 | 27.12 |
Monthly price and volumes Liquidia Technologies
| Date |
Closing |
Open |
Range |
Volume |
Tue 21 October 2025 |
23.59 (3.74%) |
22.25 |
21.35 - 25.12 |
0.8465 times |
Tue 30 September 2025 |
22.74 (-17.85%) |
29.05 |
21.15 - 29.94 |
1.5702 times |
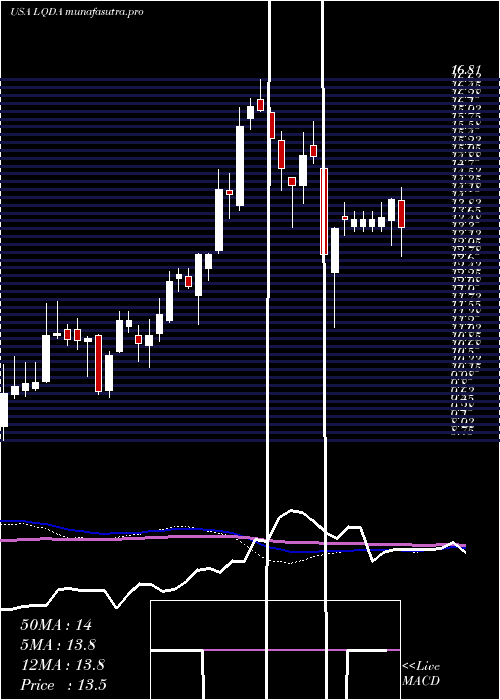
Fri 29 August 2025 |
27.68 (48.1%) |
18.48 |
16.82 - 28.82 |
1.648 times |
Thu 31 July 2025 |
18.69 (50%) |
12.43 |
11.85 - 20.33 |
1.3514 times |
Mon 30 June 2025 |
12.46 (-16.49%) |
16.74 |
12.32 - 18.60 |
1.456 times |
Fri 30 May 2025 |
14.92 (6.8%) |
13.98 |
13.81 - 19.41 |
1.0872 times |
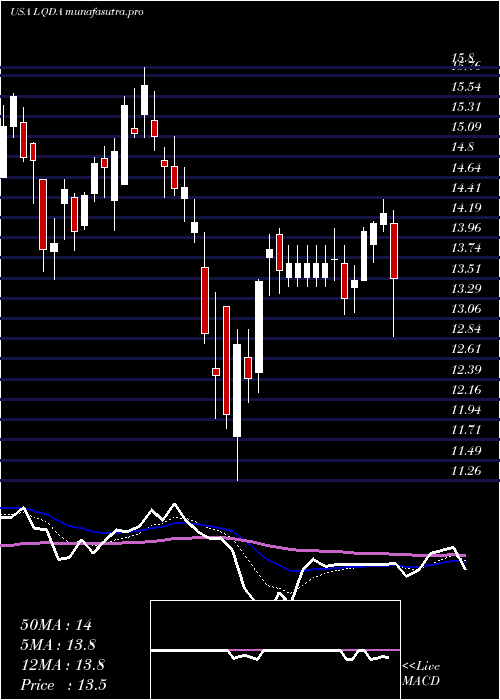
Wed 30 April 2025 |
13.97 (-5.29%) |
14.75 |
11.26 - 15.09 |
0.6658 times |
Mon 31 March 2025 |
14.75 (-4.78%) |
15.45 |
13.50 - 15.86 |
0.4657 times |
Fri 28 February 2025 |
15.49 (8.85%) |
14.00 |
13.89 - 16.81 |
0.3983 times |
Fri 31 January 2025 |
14.23 (21%) |
11.81 |
11.34 - 14.80 |
0.5109 times |
Tue 31 December 2024 |
11.76 (2.98%) |
11.08 |
10.37 - 11.91 |
0.2938 times |

DMA SMA EMA moving averages of Liquidia Technologies LQDA
DMA (daily moving average) of Liquidia Technologies LQDA
| DMA period | DMA value | | 5 day DMA | 23.45 | | 12 day DMA | 23.52 | | 20 day DMA | 23.02 | | 35 day DMA | 24.42 | | 50 day DMA | 25.24 | | 100 day DMA | 20.57 | | 150 day DMA | 18.64 | | 200 day DMA | 17.6 | EMA (exponential moving average) of Liquidia Technologies LQDA
| EMA period | EMA current | EMA prev | EMA prev2 | | 5 day EMA | 23.57 | 23.56 | 23.12 | | 12 day EMA | 23.45 | 23.42 | 23.24 | | 20 day EMA | 23.57 | 23.57 | 23.48 | | 35 day EMA | 24.03 | 24.06 | 24.04 | | 50 day EMA | 24.72 | 24.77 | 24.78 |
SMA (simple moving average) of Liquidia Technologies LQDA
| SMA period | SMA current | SMA prev | SMA prev2 | | 5 day SMA | 23.45 | 23.29 | 23.15 | | 12 day SMA | 23.52 | 23.42 | 23.21 | | 20 day SMA | 23.02 | 22.96 | 22.88 | | 35 day SMA | 24.42 | 24.57 | 24.66 | | 50 day SMA | 25.24 | 25.25 | 25.18 | | 100 day SMA | 20.57 | 20.48 | 20.39 | | 150 day SMA | 18.64 | 18.58 | 18.51 | | 200 day SMA | 17.6 | 17.55 | 17.48 |
|
|
