LplFinancial LPLA full analysis,charts,indicators,moving averages,SMA,DMA,EMA,ADX,MACD,RSILpl Financial LPLA WideScreen charts, DMA,SMA,EMA technical analysis, forecast prediction, by indicators ADX,MACD,RSI,CCI USA stock exchange
operates under Finance sector & deals in Investment Bankers Brokers Service
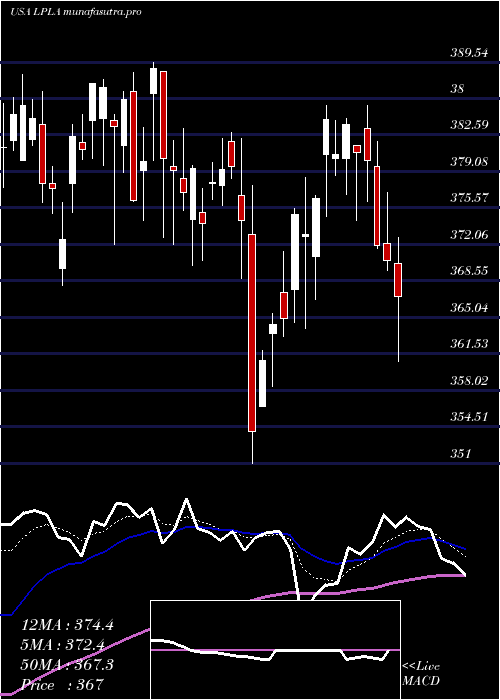
Daily price and charts and targets LplFinancial Strong Daily Stock price targets for LplFinancial LPLA are 365 and 373.64 | Daily Target 1 | 357.85 | | Daily Target 2 | 363.51 | | Daily Target 3 | 366.48666666667 | | Daily Target 4 | 372.15 | | Daily Target 5 | 375.13 |
Daily price and volume Lpl Financial
| Date |
Closing |
Open |
Range |
Volume |
Thu 04 December 2025 |
369.18 (2.2%) |
363.99 |
360.82 - 369.46 |
0.9053 times |
Wed 03 December 2025 |
361.23 (1.65%) |
355.16 |
354.11 - 362.10 |
1.045 times |
Tue 02 December 2025 |
355.35 (-0.82%) |
358.83 |
355.22 - 359.96 |
0.7454 times |
Mon 01 December 2025 |
358.29 (0.63%) |
352.48 |
351.41 - 360.54 |
0.8678 times |
Fri 28 November 2025 |
356.04 (0.66%) |
359.59 |
355.02 - 359.59 |
0.3859 times |
Wed 26 November 2025 |
353.71 (1.52%) |
350.21 |
350.21 - 356.01 |
0.7654 times |
Tue 25 November 2025 |
348.40 (0.06%) |
346.73 |
342.51 - 349.69 |
0.8334 times |
Mon 24 November 2025 |
348.19 (1.21%) |
343.72 |
340.96 - 350.68 |
1.3761 times |
Fri 21 November 2025 |
344.02 (0.34%) |
345.07 |
334.70 - 346.25 |
1.5022 times |
Thu 20 November 2025 |
342.86 (-3.79%) |
358.39 |
340.77 - 364.38 |
1.5735 times |
Wed 19 November 2025 |
356.37 (0.22%) |
357.39 |
353.09 - 362.55 |
0.8278 times |
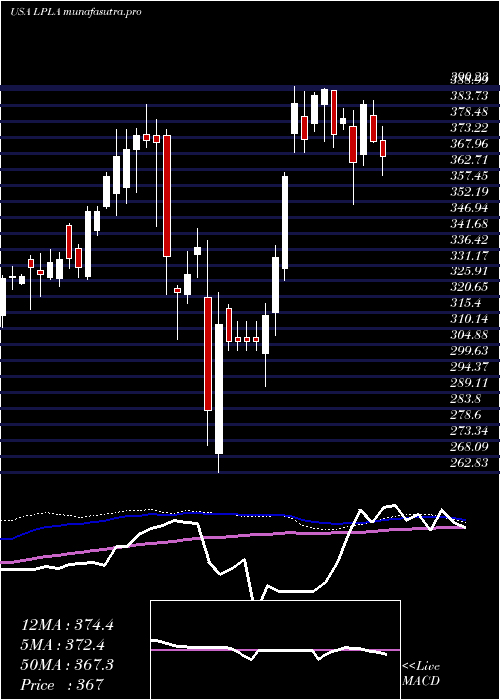
Weekly price and charts LplFinancial Strong weekly Stock price targets for LplFinancial LPLA are 360.3 and 378.35 | Weekly Target 1 | 345.3 | | Weekly Target 2 | 357.24 | | Weekly Target 3 | 363.35 | | Weekly Target 4 | 375.29 | | Weekly Target 5 | 381.4 |
Weekly price and volumes for Lpl Financial
| Date |
Closing |
Open |
Range |
Volume |
Thu 04 December 2025 |
369.18 (3.69%) |
352.48 |
351.41 - 369.46 |
0.5113 times |
Fri 28 November 2025 |
356.04 (3.49%) |
343.72 |
340.96 - 359.59 |
0.4822 times |
Fri 21 November 2025 |
344.02 (-7.17%) |
368.32 |
334.70 - 371.57 |
1.0401 times |
Fri 14 November 2025 |
370.59 (-0.78%) |
375.36 |
365.35 - 385.44 |
0.7361 times |
Fri 07 November 2025 |
373.50 (-1.01%) |
374.30 |
363.75 - 380.63 |
0.7455 times |
Fri 31 October 2025 |
377.31 (0%) |
375.65 |
368.38 - 395.75 |
0.8026 times |
Fri 31 October 2025 |
377.31 (10.89%) |
342.46 |
336.96 - 395.75 |
1.8683 times |
Fri 24 October 2025 |
340.25 (0.68%) |
340.14 |
336.72 - 345.15 |
0.9023 times |
Fri 17 October 2025 |
337.94 (7.2%) |
318.05 |
315.13 - 341.25 |
1.7375 times |
Fri 10 October 2025 |
315.24 (0.16%) |
322.04 |
310.70 - 331.56 |
1.1742 times |
Fri 03 October 2025 |
314.73 (-7.57%) |
340.13 |
311.63 - 342.30 |
1.3884 times |
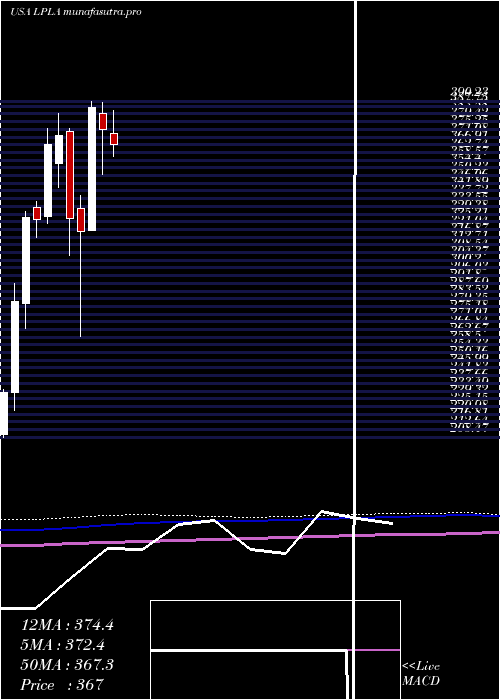
Monthly price and charts LplFinancial Strong monthly Stock price targets for LplFinancial LPLA are 360.3 and 378.35 | Monthly Target 1 | 345.3 | | Monthly Target 2 | 357.24 | | Monthly Target 3 | 363.35 | | Monthly Target 4 | 375.29 | | Monthly Target 5 | 381.4 |
Monthly price and volumes Lpl Financial
| Date |
Closing |
Open |
Range |
Volume |
Thu 04 December 2025 |
369.18 (3.69%) |
352.48 |
351.41 - 369.46 |
0.108 times |
Fri 28 November 2025 |
356.04 (-5.64%) |
374.30 |
334.70 - 385.44 |
0.6344 times |
Fri 31 October 2025 |
377.31 (13.41%) |
328.53 |
310.70 - 395.75 |
1.588 times |
Tue 30 September 2025 |
332.69 (-8.72%) |
361.25 |
318.87 - 364.58 |
1.2888 times |
Fri 29 August 2025 |
364.48 (-7.9%) |
375.66 |
343.11 - 388.79 |
1.0026 times |
Thu 31 July 2025 |
395.73 (5.54%) |
372.79 |
359.08 - 403.58 |
1.0731 times |
Mon 30 June 2025 |
374.97 (-3.15%) |
383.99 |
351.00 - 389.54 |
0.7508 times |
Fri 30 May 2025 |
387.16 (21.07%) |
320.21 |
320.21 - 390.23 |
0.8666 times |
Wed 30 April 2025 |
319.79 (-2.25%) |
332.57 |
262.83 - 339.33 |
1.5491 times |
Mon 31 March 2025 |
327.14 (-12%) |
373.94 |
306.71 - 375.90 |
1.1387 times |
Fri 28 February 2025 |
371.74 (1.32%) |
356.59 |
343.78 - 384.04 |
0.9747 times |
DMA SMA EMA moving averages of Lpl Financial LPLA
DMA (daily moving average) of Lpl Financial LPLA
| DMA period | DMA value | | 5 day DMA | 360.02 | | 12 day DMA | 354.1 | | 20 day DMA | 361.48 | | 35 day DMA | 356.26 | | 50 day DMA | 346.58 | | 100 day DMA | 353.97 | | 150 day DMA | 360.03 | | 200 day DMA | 351.98 | EMA (exponential moving average) of Lpl Financial LPLA
| EMA period | EMA current | EMA prev | EMA prev2 | | 5 day EMA | 361.05 | 356.98 | 354.85 | | 12 day EMA | 358.49 | 356.55 | 355.7 | | 20 day EMA | 357.58 | 356.36 | 355.85 | | 35 day EMA | 352.39 | 351.4 | 350.82 | | 50 day EMA | 347.19 | 346.29 | 345.68 |
SMA (simple moving average) of Lpl Financial LPLA
| SMA period | SMA current | SMA prev | SMA prev2 | | 5 day SMA | 360.02 | 356.92 | 354.36 | | 12 day SMA | 354.1 | 353.45 | 354.23 | | 20 day SMA | 361.48 | 361.75 | 362.41 | | 35 day SMA | 356.26 | 355.12 | 353.97 | | 50 day SMA | 346.58 | 345.86 | 345.45 | | 100 day SMA | 353.97 | 353.95 | 354.05 | | 150 day SMA | 360.03 | 359.7 | 359.42 | | 200 day SMA | 351.98 | 352.01 | 352.06 |
|
|
