LoweS LOW full analysis,charts,indicators,moving averages,SMA,DMA,EMA,ADX,MACD,RSILowe S LOW WideScreen charts, DMA,SMA,EMA technical analysis, forecast prediction, by indicators ADX,MACD,RSI,CCI USA stock exchange
operates under Consumer Services sector & deals in RETAIL Building Materials
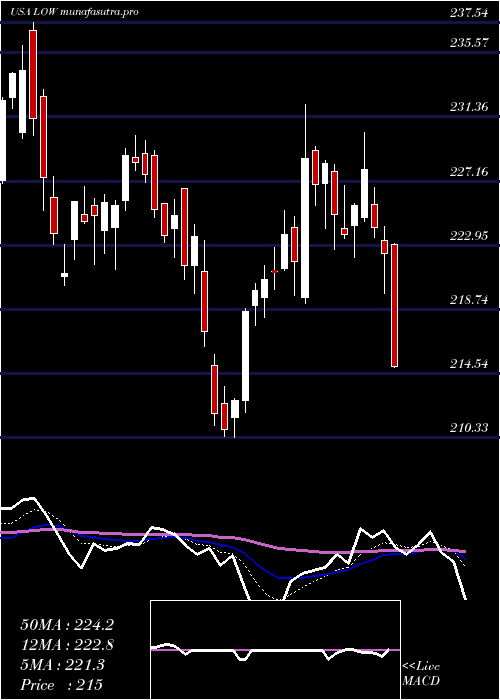
Daily price and charts and targets LoweS Strong Daily Stock price targets for LoweS LOW are 244.01 and 247.17 | Daily Target 1 | 243.28 | | Daily Target 2 | 244.73 | | Daily Target 3 | 246.44333333333 | | Daily Target 4 | 247.89 | | Daily Target 5 | 249.6 |
Daily price and volume Lowe S
| Date |
Closing |
Open |
Range |
Volume |
Thu 04 December 2025 |
246.17 (-0.31%) |
246.60 |
245.00 - 248.16 |
1.1421 times |
Wed 03 December 2025 |
246.94 (1.55%) |
243.18 |
243.18 - 247.99 |
0.9141 times |
Tue 02 December 2025 |
243.17 (-1.31%) |
246.31 |
242.60 - 247.22 |
1.0844 times |
Mon 01 December 2025 |
246.39 (1.61%) |
242.00 |
241.26 - 249.44 |
1.1394 times |
Fri 28 November 2025 |
242.48 (0.36%) |
241.59 |
240.80 - 243.03 |
0.36 times |
Wed 26 November 2025 |
241.61 (1.47%) |
237.50 |
236.65 - 243.05 |
0.6428 times |
Tue 25 November 2025 |
238.11 (4.09%) |
229.02 |
228.76 - 238.91 |
0.5111 times |
Mon 24 November 2025 |
228.76 (-2.36%) |
234.00 |
228.73 - 234.46 |
1.1756 times |
Fri 21 November 2025 |
234.29 (2.57%) |
230.54 |
228.96 - 236.56 |
1.6995 times |
Thu 20 November 2025 |
228.43 (0.01%) |
228.08 |
225.78 - 230.45 |
1.331 times |
Wed 19 November 2025 |
228.41 (3.88%) |
230.01 |
224.26 - 232.97 |
2.1568 times |
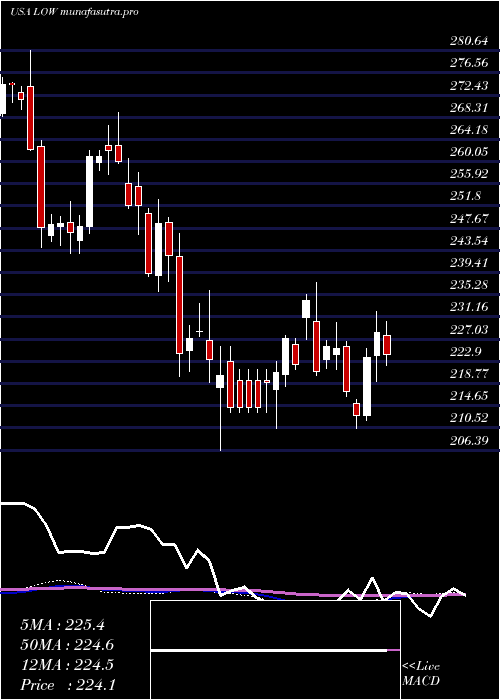
Weekly price and charts LoweS Strong weekly Stock price targets for LoweS LOW are 243.72 and 251.9 | Weekly Target 1 | 237.44 | | Weekly Target 2 | 241.81 | | Weekly Target 3 | 245.62333333333 | | Weekly Target 4 | 249.99 | | Weekly Target 5 | 253.8 |
Weekly price and volumes for Lowe S
| Date |
Closing |
Open |
Range |
Volume |
Thu 04 December 2025 |
246.17 (1.52%) |
242.00 |
241.26 - 249.44 |
1.2955 times |
Fri 28 November 2025 |
242.48 (3.5%) |
234.00 |
228.73 - 243.05 |
0.8141 times |
Fri 21 November 2025 |
234.29 (2.83%) |
227.20 |
216.00 - 236.56 |
2.2815 times |
Fri 14 November 2025 |
227.85 (-2.28%) |
232.61 |
226.97 - 236.86 |
1.0934 times |
Fri 07 November 2025 |
233.16 (-2.09%) |
233.69 |
231.12 - 238.13 |
0.9036 times |
Fri 31 October 2025 |
238.13 (0%) |
238.08 |
236.45 - 239.34 |
0.2031 times |
Fri 31 October 2025 |
238.13 (-1.89%) |
243.45 |
236.45 - 246.63 |
0.9423 times |
Fri 24 October 2025 |
242.71 (-0.81%) |
244.98 |
239.99 - 247.00 |
0.905 times |
Fri 17 October 2025 |
244.70 (2.01%) |
233.00 |
232.64 - 246.08 |
1.1471 times |
Tue 07 October 2025 |
239.89 (-2.62%) |
246.75 |
237.95 - 246.75 |
0.4145 times |
Fri 03 October 2025 |
246.35 (-4.19%) |
257.13 |
245.53 - 257.34 |
1.073 times |
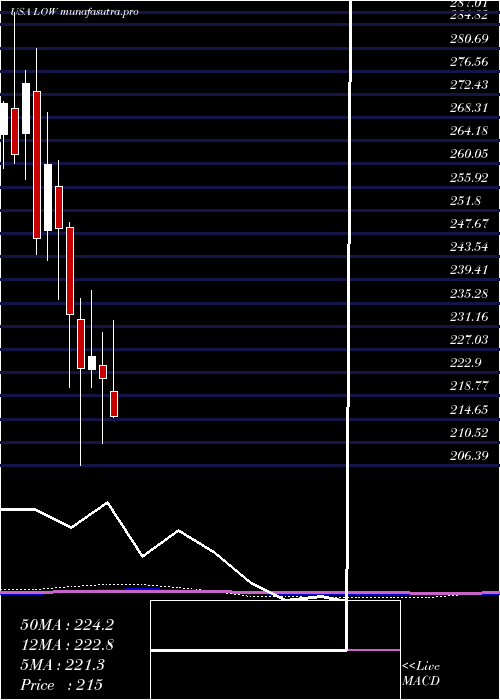
Monthly price and charts LoweS Strong monthly Stock price targets for LoweS LOW are 243.72 and 251.9 | Monthly Target 1 | 237.44 | | Monthly Target 2 | 241.81 | | Monthly Target 3 | 245.62333333333 | | Monthly Target 4 | 249.99 | | Monthly Target 5 | 253.8 |
Monthly price and volumes Lowe S
| Date |
Closing |
Open |
Range |
Volume |
Thu 04 December 2025 |
246.17 (1.52%) |
242.00 |
241.26 - 249.44 |
0.2913 times |
Fri 28 November 2025 |
242.48 (1.83%) |
233.69 |
216.00 - 243.05 |
1.1451 times |
Fri 31 October 2025 |
238.13 (-5.24%) |
251.11 |
232.64 - 251.26 |
0.932 times |
Tue 30 September 2025 |
251.31 (-2.62%) |
256.45 |
249.63 - 274.98 |
1.1355 times |
Fri 29 August 2025 |
258.06 (15.43%) |
223.51 |
221.76 - 267.52 |
1.2325 times |
Thu 31 July 2025 |
223.57 (0.77%) |
219.52 |
212.56 - 232.17 |
1.0688 times |
Mon 30 June 2025 |
221.87 (-1.71%) |
224.09 |
210.33 - 230.10 |
0.9722 times |
Fri 30 May 2025 |
225.73 (0.97%) |
223.49 |
220.26 - 237.54 |
1.1171 times |
Wed 30 April 2025 |
223.56 (-4.15%) |
232.40 |
206.39 - 236.11 |
1.0977 times |
Mon 31 March 2025 |
233.23 (-6.2%) |
248.68 |
220.17 - 249.68 |
1.0078 times |
Fri 28 February 2025 |
248.64 (-4.38%) |
256.04 |
235.93 - 260.61 |
0.9348 times |
DMA SMA EMA moving averages of Lowe S LOW
DMA (daily moving average) of Lowe S LOW
| DMA period | DMA value | | 5 day DMA | 245.03 | | 12 day DMA | 237.05 | | 20 day DMA | 234.83 | | 35 day DMA | 237.61 | | 50 day DMA | 241.03 | | 100 day DMA | 244.19 | | 150 day DMA | 237.64 | | 200 day DMA | 235.7 | EMA (exponential moving average) of Lowe S LOW
| EMA period | EMA current | EMA prev | EMA prev2 | | 5 day EMA | 244.26 | 243.3 | 241.48 | | 12 day EMA | 240.05 | 238.94 | 237.49 | | 20 day EMA | 238.7 | 237.91 | 236.96 | | 35 day EMA | 240.4 | 240.06 | 239.65 | | 50 day EMA | 243.71 | 243.61 | 243.47 |
SMA (simple moving average) of Lowe S LOW
| SMA period | SMA current | SMA prev | SMA prev2 | | 5 day SMA | 245.03 | 244.12 | 242.35 | | 12 day SMA | 237.05 | 235.29 | 233.7 | | 20 day SMA | 234.83 | 234.24 | 233.78 | | 35 day SMA | 237.61 | 237.48 | 237.3 | | 50 day SMA | 241.03 | 241.41 | 241.82 | | 100 day SMA | 244.19 | 244 | 243.79 | | 150 day SMA | 237.64 | 237.47 | 237.31 | | 200 day SMA | 235.7 | 235.73 | 235.75 |
|
|
