ManhattanBridge LOAN full analysis,charts,indicators,moving averages,SMA,DMA,EMA,ADX,MACD,RSIManhattan Bridge LOAN WideScreen charts, DMA,SMA,EMA technical analysis, forecast prediction, by indicators ADX,MACD,RSI,CCI USA stock exchange
operates under Consumer Services sector & deals in Real Estate Investment Trusts
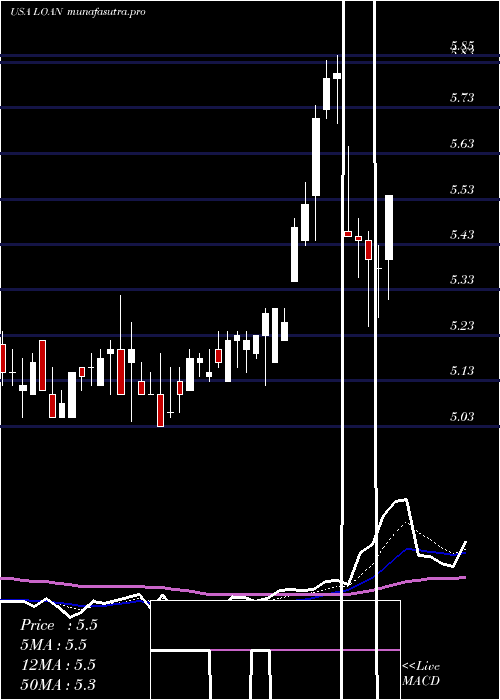
Daily price and charts and targets ManhattanBridge Strong Daily Stock price targets for ManhattanBridge LOAN are 5.23 and 5.31 | Daily Target 1 | 5.16 | | Daily Target 2 | 5.21 | | Daily Target 3 | 5.2433333333333 | | Daily Target 4 | 5.29 | | Daily Target 5 | 5.32 |
Daily price and volume Manhattan Bridge
| Date |
Closing |
Open |
Range |
Volume |
Mon 20 October 2025 |
5.25 (0.38%) |
5.22 |
5.20 - 5.28 |
0.2565 times |
Fri 17 October 2025 |
5.23 (1.55%) |
5.20 |
5.19 - 5.27 |
0.3055 times |
Thu 16 October 2025 |
5.15 (-2.46%) |
5.28 |
5.13 - 5.35 |
2.1485 times |
Wed 15 October 2025 |
5.28 (-0.94%) |
5.35 |
5.27 - 5.41 |
0.7865 times |
Tue 14 October 2025 |
5.33 (0.95%) |
5.29 |
5.25 - 5.38 |
1.0278 times |
Mon 13 October 2025 |
5.28 (-0.38%) |
5.33 |
5.25 - 5.38 |
0.2633 times |
Fri 10 October 2025 |
5.30 (0.38%) |
5.32 |
5.25 - 5.42 |
1.2928 times |
Thu 09 October 2025 |
5.28 (-2.22%) |
5.39 |
5.26 - 5.39 |
0.7747 times |
Wed 08 October 2025 |
5.40 (-4.59%) |
5.58 |
5.38 - 5.66 |
1.4042 times |
Tue 07 October 2025 |
5.66 (-1.05%) |
5.72 |
5.64 - 5.80 |
1.7401 times |
Mon 06 October 2025 |
5.72 (1.78%) |
5.66 |
5.60 - 5.72 |
1.1335 times |
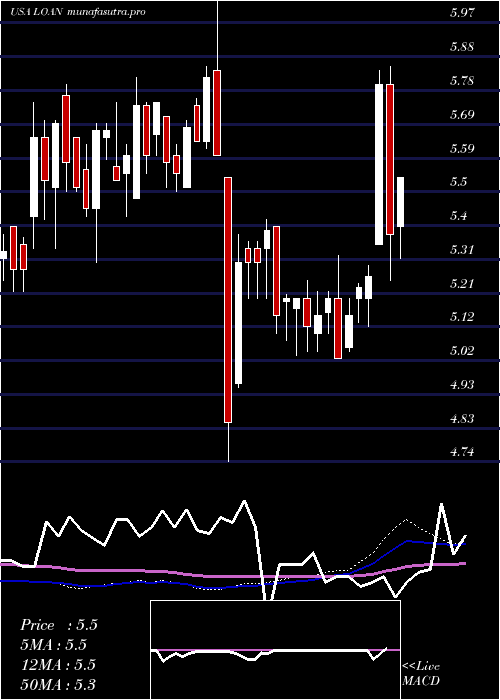
Weekly price and charts ManhattanBridge Strong weekly Stock price targets for ManhattanBridge LOAN are 5.23 and 5.31 | Weekly Target 1 | 5.16 | | Weekly Target 2 | 5.21 | | Weekly Target 3 | 5.2433333333333 | | Weekly Target 4 | 5.29 | | Weekly Target 5 | 5.32 |
Weekly price and volumes for Manhattan Bridge
| Date |
Closing |
Open |
Range |
Volume |
Mon 20 October 2025 |
5.25 (0.38%) |
5.22 |
5.20 - 5.28 |
0.1138 times |
Fri 17 October 2025 |
5.23 (-1.32%) |
5.33 |
5.13 - 5.41 |
2.0095 times |
Fri 10 October 2025 |
5.30 (-5.69%) |
5.66 |
5.25 - 5.80 |
2.8137 times |
Fri 03 October 2025 |
5.62 (2.93%) |
5.48 |
5.41 - 5.68 |
0.9259 times |
Fri 26 September 2025 |
5.46 (2.06%) |
5.30 |
5.30 - 5.50 |
0.6182 times |
Fri 19 September 2025 |
5.35 (-0.19%) |
5.34 |
5.28 - 5.45 |
0.9452 times |
Fri 12 September 2025 |
5.36 (-0.37%) |
5.37 |
5.30 - 5.42 |
0.4056 times |
Fri 05 September 2025 |
5.38 (1.32%) |
5.27 |
5.16 - 5.44 |
1.0755 times |
Fri 29 August 2025 |
5.31 (0%) |
5.25 |
5.25 - 5.33 |
0.2051 times |
Fri 29 August 2025 |
5.31 (-1.48%) |
5.42 |
5.25 - 5.44 |
0.8876 times |
Fri 22 August 2025 |
5.39 (0.19%) |
5.39 |
5.35 - 5.49 |
0.5366 times |
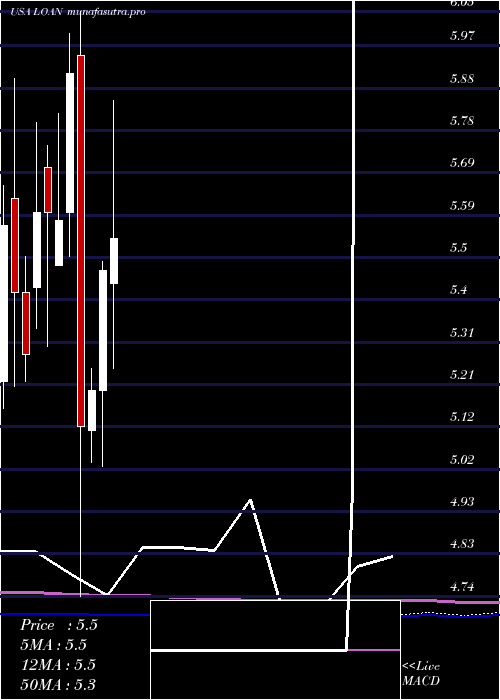
Monthly price and charts ManhattanBridge Strong monthly Stock price targets for ManhattanBridge LOAN are 4.86 and 5.53 | Monthly Target 1 | 4.72 | | Monthly Target 2 | 4.99 | | Monthly Target 3 | 5.3933333333333 | | Monthly Target 4 | 5.66 | | Monthly Target 5 | 6.06 |
Monthly price and volumes Manhattan Bridge
| Date |
Closing |
Open |
Range |
Volume |
Mon 20 October 2025 |
5.25 (-4.37%) |
5.56 |
5.13 - 5.80 |
1.7801 times |
Tue 30 September 2025 |
5.49 (3.39%) |
5.27 |
5.16 - 5.56 |
1.1001 times |
Fri 29 August 2025 |
5.31 (-2.75%) |
5.45 |
5.25 - 5.64 |
1.1071 times |
Thu 31 July 2025 |
5.46 (-0.18%) |
5.44 |
5.25 - 5.85 |
1.3057 times |
Mon 30 June 2025 |
5.47 (5.19%) |
5.20 |
5.03 - 5.49 |
0.6345 times |
Fri 30 May 2025 |
5.20 (1.56%) |
5.11 |
5.04 - 5.25 |
0.7507 times |
Wed 30 April 2025 |
5.12 (-13.37%) |
5.95 |
4.74 - 6.05 |
1.4087 times |
Mon 31 March 2025 |
5.91 (5.91%) |
5.60 |
5.50 - 6.00 |
0.6515 times |
Fri 28 February 2025 |
5.58 (-0.36%) |
5.48 |
5.48 - 5.82 |
0.5046 times |
Fri 31 January 2025 |
5.60 (0%) |
5.70 |
5.30 - 5.75 |
0.757 times |
Tue 31 December 2024 |
5.60 (6.06%) |
5.43 |
5.34 - 5.80 |
0.9162 times |
DMA SMA EMA moving averages of Manhattan Bridge LOAN
DMA (daily moving average) of Manhattan Bridge LOAN
| DMA period | DMA value | | 5 day DMA | 5.25 | | 12 day DMA | 5.38 | | 20 day DMA | 5.42 | | 35 day DMA | 5.39 | | 50 day DMA | 5.39 | | 100 day DMA | 5.38 | | 150 day DMA | 5.35 | | 200 day DMA | 5.41 | EMA (exponential moving average) of Manhattan Bridge LOAN
| EMA period | EMA current | EMA prev | EMA prev2 | | 5 day EMA | 5.26 | 5.26 | 5.27 | | 12 day EMA | 5.32 | 5.33 | 5.35 | | 20 day EMA | 5.36 | 5.37 | 5.39 | | 35 day EMA | 5.38 | 5.39 | 5.4 | | 50 day EMA | 5.38 | 5.39 | 5.4 |
SMA (simple moving average) of Manhattan Bridge LOAN
| SMA period | SMA current | SMA prev | SMA prev2 | | 5 day SMA | 5.25 | 5.25 | 5.27 | | 12 day SMA | 5.38 | 5.4 | 5.43 | | 20 day SMA | 5.42 | 5.42 | 5.43 | | 35 day SMA | 5.39 | 5.39 | 5.4 | | 50 day SMA | 5.39 | 5.39 | 5.4 | | 100 day SMA | 5.38 | 5.37 | 5.37 | | 150 day SMA | 5.35 | 5.36 | 5.36 | | 200 day SMA | 5.41 | 5.42 | 5.42 |
|
|
