LantheusHoldings LNTH full analysis,charts,indicators,moving averages,SMA,DMA,EMA,ADX,MACD,RSILantheus Holdings LNTH WideScreen charts, DMA,SMA,EMA technical analysis, forecast prediction, by indicators ADX,MACD,RSI,CCI USA stock exchange
operates under Health Care sector & deals in Biotechnology In Vitro In Vivo Diagnostic Substances
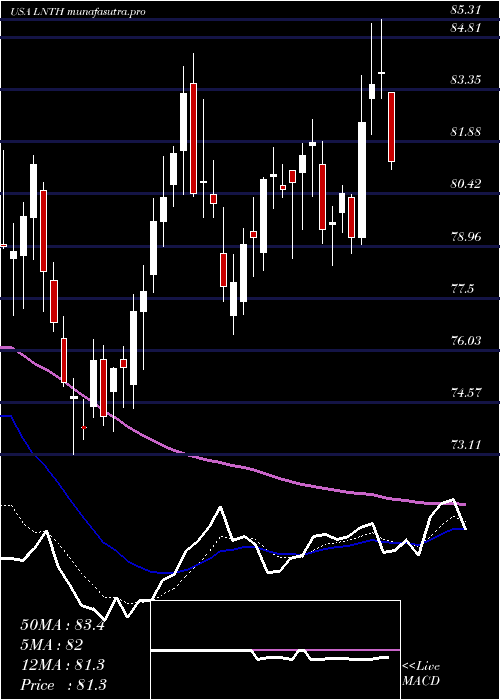
Daily price and charts and targets LantheusHoldings Strong Daily Stock price targets for LantheusHoldings LNTH are 56.19 and 57.36 | Daily Target 1 | 55.27 | | Daily Target 2 | 55.93 | | Daily Target 3 | 56.436666666667 | | Daily Target 4 | 57.1 | | Daily Target 5 | 57.61 |
Daily price and volume Lantheus Holdings
| Date |
Closing |
Open |
Range |
Volume |
Mon 20 October 2025 |
56.60 (1.8%) |
56.09 |
55.77 - 56.94 |
0.7214 times |
Fri 17 October 2025 |
55.60 (-0.27%) |
55.95 |
54.99 - 56.58 |
0.8417 times |
Thu 16 October 2025 |
55.75 (-1.36%) |
56.51 |
55.75 - 57.97 |
0.5363 times |
Wed 15 October 2025 |
56.52 (2.63%) |
55.36 |
54.77 - 56.67 |
0.9893 times |
Tue 14 October 2025 |
55.07 (0.88%) |
54.46 |
53.97 - 56.56 |
1.294 times |
Mon 13 October 2025 |
54.59 (1.96%) |
53.50 |
53.13 - 54.62 |
1.2433 times |
Fri 10 October 2025 |
53.54 (2.2%) |
52.65 |
52.21 - 53.83 |
1.6335 times |
Thu 09 October 2025 |
52.39 (-2.17%) |
53.81 |
52.34 - 53.83 |
0.7127 times |
Wed 08 October 2025 |
53.55 (3.3%) |
50.50 |
49.67 - 53.57 |
1.5508 times |
Tue 07 October 2025 |
51.84 (-1.63%) |
53.41 |
51.79 - 53.59 |
0.4769 times |
Mon 06 October 2025 |
52.70 (-2.1%) |
53.84 |
52.64 - 54.00 |
0.6822 times |
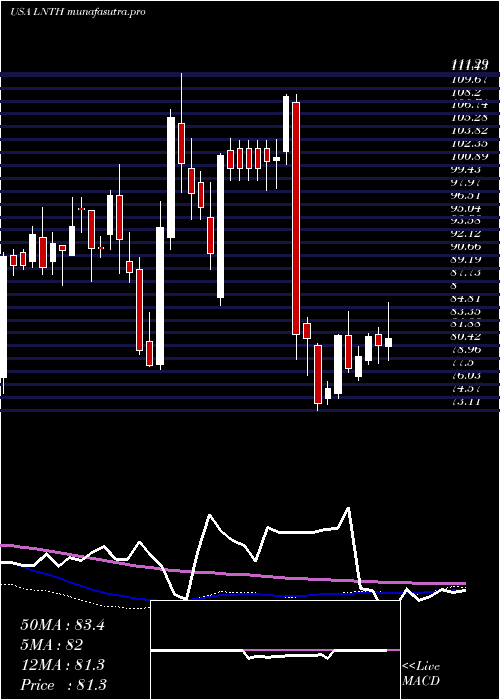
Weekly price and charts LantheusHoldings Strong weekly Stock price targets for LantheusHoldings LNTH are 56.19 and 57.36 | Weekly Target 1 | 55.27 | | Weekly Target 2 | 55.93 | | Weekly Target 3 | 56.436666666667 | | Weekly Target 4 | 57.1 | | Weekly Target 5 | 57.61 |
Weekly price and volumes for Lantheus Holdings
| Date |
Closing |
Open |
Range |
Volume |
Mon 20 October 2025 |
56.60 (1.8%) |
56.09 |
55.77 - 56.94 |
0.2244 times |
Fri 17 October 2025 |
55.60 (3.85%) |
53.50 |
53.13 - 57.97 |
1.5254 times |
Fri 10 October 2025 |
53.54 (-0.54%) |
53.84 |
49.67 - 54.00 |
1.5725 times |
Fri 03 October 2025 |
53.83 (6.36%) |
50.50 |
49.75 - 53.97 |
0.9198 times |
Fri 26 September 2025 |
50.61 (0.4%) |
50.39 |
49.97 - 54.43 |
1.7332 times |
Fri 19 September 2025 |
50.41 (-4.78%) |
52.78 |
50.12 - 52.93 |
1.1976 times |
Fri 12 September 2025 |
52.94 (-3.31%) |
54.24 |
51.94 - 55.24 |
1.0564 times |
Fri 05 September 2025 |
54.75 (-0.27%) |
54.46 |
53.10 - 55.69 |
0.7455 times |
Fri 29 August 2025 |
54.90 (0%) |
55.36 |
54.78 - 55.66 |
0.178 times |
Fri 29 August 2025 |
54.90 (-5.69%) |
58.00 |
54.78 - 58.65 |
0.8472 times |
Fri 22 August 2025 |
58.21 (7.44%) |
54.59 |
54.21 - 60.13 |
2.5015 times |
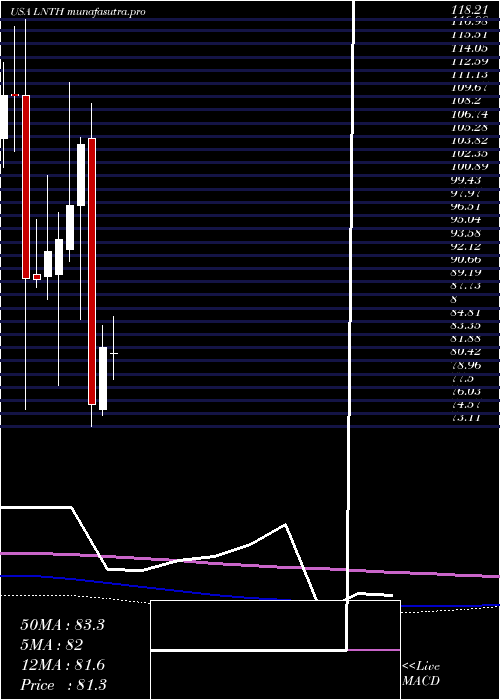
Monthly price and charts LantheusHoldings Strong monthly Stock price targets for LantheusHoldings LNTH are 53.14 and 61.44 | Monthly Target 1 | 46.45 | | Monthly Target 2 | 51.52 | | Monthly Target 3 | 54.746666666667 | | Monthly Target 4 | 59.82 | | Monthly Target 5 | 63.05 |
Monthly price and volumes Lantheus Holdings
| Date |
Closing |
Open |
Range |
Volume |
Mon 20 October 2025 |
56.60 (10.35%) |
51.10 |
49.67 - 57.97 |
0.8637 times |
Tue 30 September 2025 |
51.29 (-6.58%) |
54.46 |
49.75 - 55.69 |
1.2235 times |
Fri 29 August 2025 |
54.90 (-22.88%) |
70.77 |
47.25 - 73.72 |
2.1506 times |
Thu 31 July 2025 |
71.19 (-13.03%) |
81.23 |
69.12 - 85.31 |
0.8885 times |
Mon 30 June 2025 |
81.86 (8.34%) |
75.08 |
74.41 - 84.36 |
0.8235 times |
Fri 30 May 2025 |
75.56 (-27.58%) |
105.03 |
73.11 - 108.91 |
1.2663 times |
Wed 30 April 2025 |
104.34 (6.91%) |
97.61 |
85.00 - 105.12 |
0.6574 times |
Mon 31 March 2025 |
97.60 (4.03%) |
92.71 |
91.40 - 111.29 |
0.6793 times |
Fri 28 February 2025 |
93.82 (1.42%) |
90.00 |
77.73 - 96.81 |
0.7711 times |
Fri 31 January 2025 |
92.51 (3.41%) |
89.80 |
87.24 - 100.99 |
0.6761 times |
Tue 31 December 2024 |
89.46 (-0.08%) |
90.00 |
88.52 - 96.07 |
0.5358 times |
DMA SMA EMA moving averages of Lantheus Holdings LNTH
DMA (daily moving average) of Lantheus Holdings LNTH
| DMA period | DMA value | | 5 day DMA | 55.91 | | 12 day DMA | 54.33 | | 20 day DMA | 53.26 | | 35 day DMA | 53.14 | | 50 day DMA | 53.9 | | 100 day DMA | 64.86 | | 150 day DMA | 74.7 | | 200 day DMA | 79.1 | EMA (exponential moving average) of Lantheus Holdings LNTH
| EMA period | EMA current | EMA prev | EMA prev2 | | 5 day EMA | 55.73 | 55.29 | 55.14 | | 12 day EMA | 54.62 | 54.26 | 54.02 | | 20 day EMA | 54.05 | 53.78 | 53.59 | | 35 day EMA | 54.14 | 53.99 | 53.9 | | 50 day EMA | 54.49 | 54.4 | 54.35 |
SMA (simple moving average) of Lantheus Holdings LNTH
| SMA period | SMA current | SMA prev | SMA prev2 | | 5 day SMA | 55.91 | 55.51 | 55.09 | | 12 day SMA | 54.33 | 53.98 | 53.65 | | 20 day SMA | 53.26 | 52.94 | 52.68 | | 35 day SMA | 53.14 | 53.09 | 53.07 | | 50 day SMA | 53.9 | 53.89 | 53.92 | | 100 day SMA | 64.86 | 65.05 | 65.23 | | 150 day SMA | 74.7 | 75 | 75.29 | | 200 day SMA | 79.1 | 79.26 | 79.43 |
|
|
