LindsayCorporation LNN full analysis,charts,indicators,moving averages,SMA,DMA,EMA,ADX,MACD,RSILindsay Corporation LNN WideScreen charts, DMA,SMA,EMA technical analysis, forecast prediction, by indicators ADX,MACD,RSI,CCI USA stock exchange
operates under Capital Goods sector & deals in Industrial Machinery Components
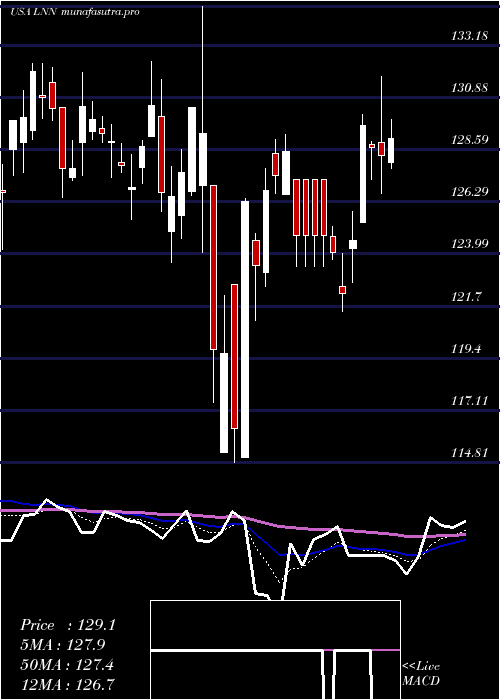
Daily price and charts and targets LindsayCorporation Strong Daily Stock price targets for LindsayCorporation LNN are 125.47 and 130.31 | Daily Target 1 | 124.27 | | Daily Target 2 | 126.67 | | Daily Target 3 | 129.10666666667 | | Daily Target 4 | 131.51 | | Daily Target 5 | 133.95 |
Daily price and volume Lindsay Corporation
| Date |
Closing |
Open |
Range |
Volume |
Mon 20 October 2025 |
129.08 (-0.61%) |
131.54 |
126.70 - 131.54 |
1.7311 times |
Fri 17 October 2025 |
129.87 (-0.88%) |
131.10 |
129.24 - 132.60 |
1.1655 times |
Thu 16 October 2025 |
131.02 (-2.56%) |
135.15 |
130.61 - 136.29 |
1.2948 times |
Wed 15 October 2025 |
134.46 (0.47%) |
135.50 |
132.71 - 135.92 |
0.76 times |
Tue 14 October 2025 |
133.83 (0.97%) |
130.91 |
130.91 - 134.69 |
0.9219 times |
Mon 13 October 2025 |
132.54 (-4.76%) |
134.19 |
132.03 - 135.63 |
1.0187 times |
Tue 07 October 2025 |
139.16 (-1%) |
140.46 |
139.11 - 141.91 |
1.2473 times |
Mon 06 October 2025 |
140.56 (-0.44%) |
141.86 |
139.95 - 142.73 |
0.2873 times |
Fri 03 October 2025 |
141.18 (-0.45%) |
142.20 |
141.07 - 143.22 |
0.9653 times |
Thu 02 October 2025 |
141.82 (1.21%) |
140.81 |
139.96 - 142.57 |
0.6082 times |
Wed 01 October 2025 |
140.12 (-0.31%) |
139.48 |
139.06 - 141.40 |
1.3248 times |
Weekly price and charts LindsayCorporation Strong weekly Stock price targets for LindsayCorporation LNN are 125.47 and 130.31 | Weekly Target 1 | 124.27 | | Weekly Target 2 | 126.67 | | Weekly Target 3 | 129.10666666667 | | Weekly Target 4 | 131.51 | | Weekly Target 5 | 133.95 |
Weekly price and volumes for Lindsay Corporation
| Date |
Closing |
Open |
Range |
Volume |
Mon 20 October 2025 |
129.08 (-0.61%) |
131.54 |
126.70 - 131.54 |
0.5196 times |
Fri 17 October 2025 |
129.87 (-6.68%) |
134.19 |
129.24 - 136.29 |
1.5491 times |
Tue 07 October 2025 |
139.16 (-1.43%) |
141.86 |
139.11 - 142.73 |
0.4606 times |
Fri 03 October 2025 |
141.18 (1.07%) |
140.14 |
138.42 - 143.22 |
1.485 times |
Fri 26 September 2025 |
139.68 (0.54%) |
138.90 |
136.93 - 142.85 |
1.364 times |
Fri 19 September 2025 |
138.93 (-0.42%) |
139.74 |
138.80 - 142.50 |
1.3758 times |
Fri 12 September 2025 |
139.52 (-0.68%) |
140.26 |
136.71 - 141.43 |
1.0878 times |
Fri 05 September 2025 |
140.48 (2.37%) |
136.44 |
135.50 - 141.00 |
0.8119 times |
Fri 29 August 2025 |
137.23 (0%) |
138.66 |
136.05 - 140.50 |
0.2286 times |
Fri 29 August 2025 |
137.23 (-4.08%) |
142.79 |
136.05 - 143.16 |
1.1176 times |
Fri 22 August 2025 |
143.07 (3.32%) |
138.68 |
137.32 - 143.81 |
0.9296 times |
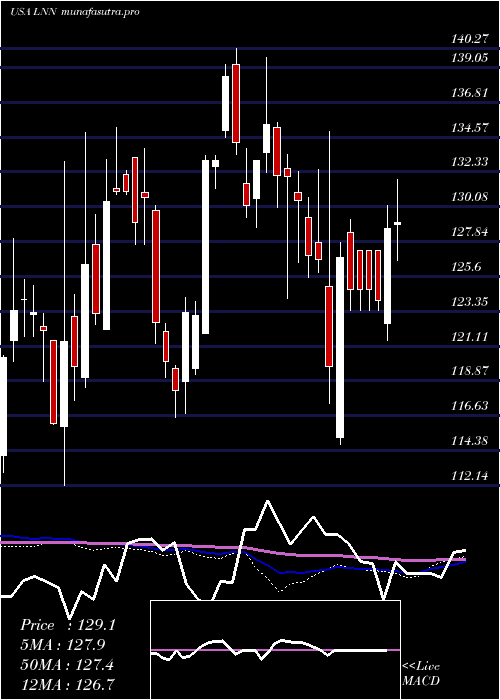
Monthly price and charts LindsayCorporation Strong monthly Stock price targets for LindsayCorporation LNN are 119.63 and 136.15 | Monthly Target 1 | 116.48 | | Monthly Target 2 | 122.78 | | Monthly Target 3 | 133 | | Monthly Target 4 | 139.3 | | Monthly Target 5 | 149.52 |
Monthly price and volumes Lindsay Corporation
| Date |
Closing |
Open |
Range |
Volume |
Mon 20 October 2025 |
129.08 (-8.17%) |
139.48 |
126.70 - 143.22 |
0.7075 times |
Tue 30 September 2025 |
140.56 (2.43%) |
136.44 |
135.50 - 142.85 |
1.0936 times |
Fri 29 August 2025 |
137.23 (0.53%) |
135.33 |
132.82 - 143.81 |
0.8795 times |
Thu 31 July 2025 |
136.51 (-5.37%) |
143.70 |
133.48 - 149.55 |
1.8486 times |
Mon 30 June 2025 |
144.25 (3.48%) |
138.98 |
133.12 - 150.96 |
1.2231 times |
Fri 30 May 2025 |
139.40 (8.01%) |
128.22 |
127.59 - 143.69 |
0.7907 times |
Wed 30 April 2025 |
129.06 (2.01%) |
125.70 |
114.81 - 134.90 |
1.0655 times |
Mon 31 March 2025 |
126.52 (-4.24%) |
132.55 |
123.63 - 133.45 |
0.7644 times |
Fri 28 February 2025 |
132.12 (-1.54%) |
131.55 |
128.74 - 139.65 |
0.6619 times |
Fri 31 January 2025 |
134.19 (13.42%) |
118.57 |
116.53 - 140.27 |
0.9652 times |
Tue 31 December 2024 |
118.31 (-9.74%) |
133.23 |
118.21 - 133.83 |
0.6421 times |

DMA SMA EMA moving averages of Lindsay Corporation LNN
DMA (daily moving average) of Lindsay Corporation LNN
| DMA period | DMA value | | 5 day DMA | 131.65 | | 12 day DMA | 136.18 | | 20 day DMA | 137.49 | | 35 day DMA | 138.07 | | 50 day DMA | 138.46 | | 100 day DMA | 138.53 | | 150 day DMA | 135.56 | | 200 day DMA | 134.28 | EMA (exponential moving average) of Lindsay Corporation LNN
| EMA period | EMA current | EMA prev | EMA prev2 | | 5 day EMA | 131.51 | 132.73 | 134.16 | | 12 day EMA | 134.53 | 135.52 | 136.55 | | 20 day EMA | 136.07 | 136.8 | 137.53 | | 35 day EMA | 137.12 | 137.59 | 138.04 | | 50 day EMA | 137.51 | 137.85 | 138.18 |
SMA (simple moving average) of Lindsay Corporation LNN
| SMA period | SMA current | SMA prev | SMA prev2 | | 5 day SMA | 131.65 | 132.34 | 134.2 | | 12 day SMA | 136.18 | 137.1 | 137.91 | | 20 day SMA | 137.49 | 138.02 | 138.55 | | 35 day SMA | 138.07 | 138.4 | 138.65 | | 50 day SMA | 138.46 | 138.58 | 138.7 | | 100 day SMA | 138.53 | 138.63 | 138.74 | | 150 day SMA | 135.56 | 135.57 | 135.58 | | 200 day SMA | 134.28 | 134.24 | 134.2 |
|
|
