LockheedMartin LMT full analysis,charts,indicators,moving averages,SMA,DMA,EMA,ADX,MACD,RSILockheed Martin LMT WideScreen charts, DMA,SMA,EMA technical analysis, forecast prediction, by indicators ADX,MACD,RSI,CCI USA stock exchange
operates under Capital Goods sector & deals in Military Government Technical
Daily price and charts and targets LockheedMartin Strong Daily Stock price targets for LockheedMartin LMT are 501.1 and 510.7 | Daily Target 1 | 493.1 | | Daily Target 2 | 499.5 | | Daily Target 3 | 502.7 | | Daily Target 4 | 509.1 | | Daily Target 5 | 512.3 |
Daily price and volume Lockheed Martin
| Date |
Closing |
Open |
Range |
Volume |
Mon 20 October 2025 |
505.90 (2.17%) |
496.48 |
496.30 - 505.90 |
0.486 times |
Fri 17 October 2025 |
495.15 (0.39%) |
490.48 |
488.10 - 496.68 |
1.8514 times |
Thu 16 October 2025 |
493.25 (-1.23%) |
500.74 |
492.00 - 501.31 |
1.0625 times |
Wed 15 October 2025 |
499.41 (-1.14%) |
503.00 |
485.48 - 505.00 |
1.6225 times |
Tue 14 October 2025 |
505.18 (0.27%) |
501.25 |
499.00 - 507.00 |
1.0423 times |
Mon 13 October 2025 |
503.83 (-1.42%) |
502.30 |
500.00 - 507.43 |
0.8958 times |
Tue 07 October 2025 |
511.07 (-0.67%) |
514.20 |
509.14 - 515.98 |
0.8917 times |
Mon 06 October 2025 |
514.50 (1.98%) |
506.00 |
505.15 - 515.43 |
0.7413 times |
Fri 03 October 2025 |
504.49 (1.03%) |
499.42 |
499.25 - 506.81 |
0.9714 times |
Thu 02 October 2025 |
499.36 (0.07%) |
500.00 |
497.01 - 503.60 |
0.4353 times |
Wed 01 October 2025 |
499.00 (-0.04%) |
496.17 |
495.00 - 504.07 |
1.1476 times |
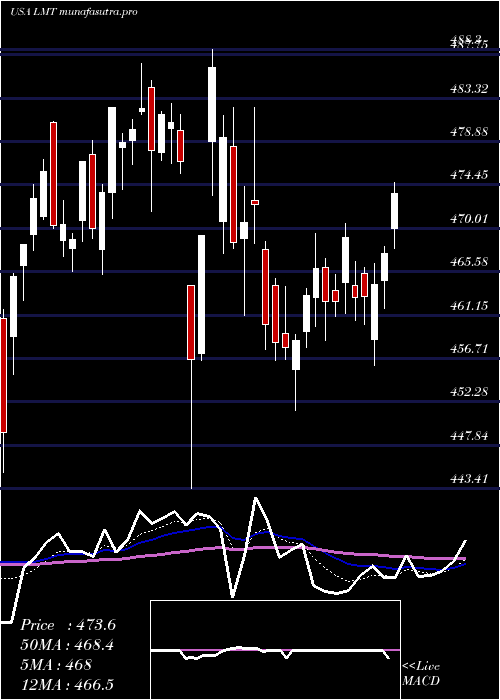
Weekly price and charts LockheedMartin Strong weekly Stock price targets for LockheedMartin LMT are 501.1 and 510.7 | Weekly Target 1 | 493.1 | | Weekly Target 2 | 499.5 | | Weekly Target 3 | 502.7 | | Weekly Target 4 | 509.1 | | Weekly Target 5 | 512.3 |
Weekly price and volumes for Lockheed Martin
| Date |
Closing |
Open |
Range |
Volume |
Mon 20 October 2025 |
505.90 (2.17%) |
496.48 |
496.30 - 505.90 |
0.1039 times |
Fri 17 October 2025 |
495.15 (-3.12%) |
502.30 |
485.48 - 507.43 |
1.3844 times |
Tue 07 October 2025 |
511.07 (1.3%) |
506.00 |
505.15 - 515.98 |
0.3492 times |
Fri 03 October 2025 |
504.49 (3.5%) |
497.00 |
489.22 - 506.81 |
1.105 times |
Fri 26 September 2025 |
487.44 (3.07%) |
473.67 |
473.01 - 495.24 |
1.2583 times |
Fri 19 September 2025 |
472.94 (0.35%) |
471.47 |
467.99 - 478.44 |
1.5025 times |
Fri 12 September 2025 |
471.31 (1.6%) |
462.92 |
452.42 - 472.98 |
1.2871 times |
Fri 05 September 2025 |
463.90 (1.82%) |
453.80 |
446.69 - 463.98 |
1.2611 times |
Fri 29 August 2025 |
455.63 (0%) |
457.52 |
454.88 - 459.90 |
0.2838 times |
Fri 29 August 2025 |
455.63 (2.11%) |
447.07 |
445.10 - 459.90 |
1.4648 times |
Fri 22 August 2025 |
446.20 (1.97%) |
440.55 |
438.60 - 452.56 |
1.3644 times |
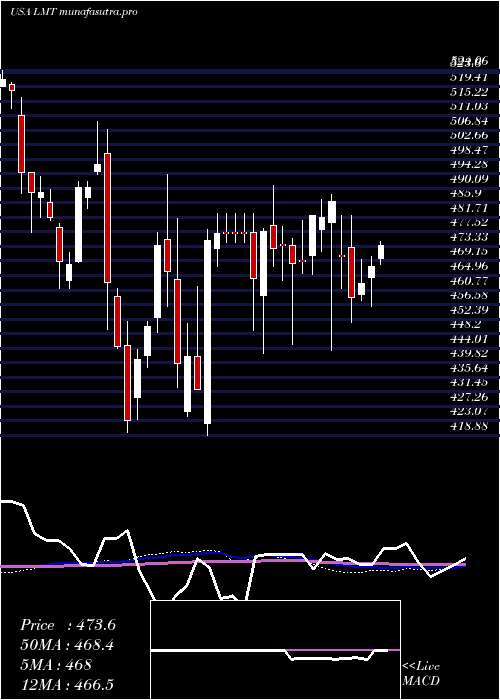
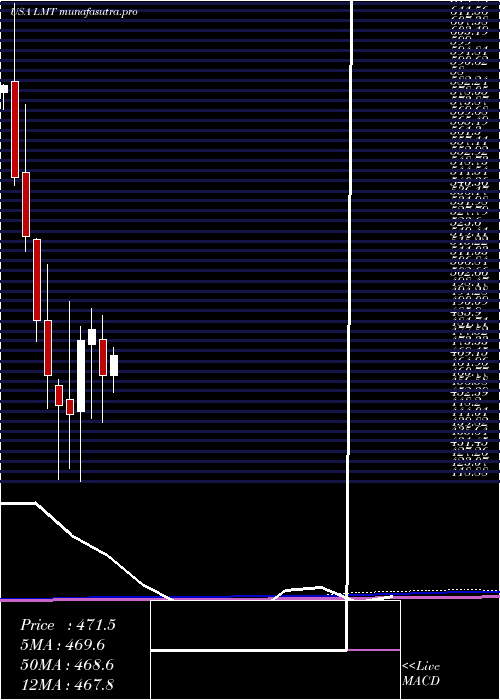
Monthly price and charts LockheedMartin Strong monthly Stock price targets for LockheedMartin LMT are 495.69 and 526.19 | Monthly Target 1 | 471.95 | | Monthly Target 2 | 488.93 | | Monthly Target 3 | 502.45333333333 | | Monthly Target 4 | 519.43 | | Monthly Target 5 | 532.95 |
Monthly price and volumes Lockheed Martin
| Date |
Closing |
Open |
Range |
Volume |
Mon 20 October 2025 |
505.90 (1.34%) |
496.17 |
485.48 - 515.98 |
0.3734 times |
Tue 30 September 2025 |
499.21 (9.56%) |
453.80 |
446.69 - 499.89 |
0.9192 times |
Fri 29 August 2025 |
455.63 (8.23%) |
420.76 |
417.00 - 459.90 |
1.0294 times |
Thu 31 July 2025 |
420.98 (-9.1%) |
463.00 |
410.11 - 474.76 |
1.4368 times |
Mon 30 June 2025 |
463.14 (-3.99%) |
478.26 |
443.41 - 488.30 |
1.0562 times |
Fri 30 May 2025 |
482.38 (0.97%) |
476.00 |
445.06 - 491.07 |
0.9076 times |
Wed 30 April 2025 |
477.75 (6.95%) |
448.00 |
418.88 - 483.79 |
1.0754 times |
Mon 31 March 2025 |
446.71 (-0.81%) |
452.87 |
424.30 - 494.20 |
1.1378 times |
Fri 28 February 2025 |
450.37 (-2.72%) |
458.80 |
419.70 - 461.33 |
1.0493 times |
Fri 31 January 2025 |
462.95 (-4.73%) |
485.94 |
449.40 - 509.55 |
1.015 times |
Tue 31 December 2024 |
485.94 (-6.81%) |
520.14 |
477.30 - 520.56 |
0.6698 times |
DMA SMA EMA moving averages of Lockheed Martin LMT
DMA (daily moving average) of Lockheed Martin LMT
| DMA period | DMA value | | 5 day DMA | 499.78 | | 12 day DMA | 502.53 | | 20 day DMA | 494.7 | | 35 day DMA | 480.76 | | 50 day DMA | 468.74 | | 100 day DMA | 464.03 | | 150 day DMA | 464.11 | | 200 day DMA | 463.9 | EMA (exponential moving average) of Lockheed Martin LMT
| EMA period | EMA current | EMA prev | EMA prev2 | | 5 day EMA | 500.89 | 498.38 | 500 | | 12 day EMA | 498.86 | 497.58 | 498.02 | | 20 day EMA | 493.33 | 492.01 | 491.68 | | 35 day EMA | 481.46 | 480.02 | 479.13 | | 50 day EMA | 468.22 | 466.68 | 465.52 |
SMA (simple moving average) of Lockheed Martin LMT
| SMA period | SMA current | SMA prev | SMA prev2 | | 5 day SMA | 499.78 | 499.36 | 502.55 | | 12 day SMA | 502.53 | 501.37 | 500.73 | | 20 day SMA | 494.7 | 493.06 | 492.02 | | 35 day SMA | 480.76 | 479.29 | 478.15 | | 50 day SMA | 468.74 | 467.32 | 465.98 | | 100 day SMA | 464.03 | 463.68 | 463.48 | | 150 day SMA | 464.11 | 463.81 | 463.64 | | 200 day SMA | 463.9 | 463.79 | 463.76 |
|
|
