LivanovaPlc LIVN full analysis,charts,indicators,moving averages,SMA,DMA,EMA,ADX,MACD,RSILivanova Plc LIVN WideScreen charts, DMA,SMA,EMA technical analysis, forecast prediction, by indicators ADX,MACD,RSI,CCI USA stock exchange
operates under Health Care sector & deals in Biotechnology Electromedical Electrotherapeutic Apparatus
Daily price and charts and targets LivanovaPlc Strong Daily Stock price targets for LivanovaPlc LIVN are 63.23 and 64.85 | Daily Target 1 | 61.93 | | Daily Target 2 | 62.91 | | Daily Target 3 | 63.546666666667 | | Daily Target 4 | 64.53 | | Daily Target 5 | 65.17 |
Daily price and volume Livanova Plc
| Date |
Closing |
Open |
Range |
Volume |
Thu 04 December 2025 |
63.90 (0.96%) |
63.18 |
62.56 - 64.18 |
0.8483 times |
Wed 03 December 2025 |
63.29 (-0.61%) |
63.63 |
62.83 - 64.19 |
0.9487 times |
Tue 02 December 2025 |
63.68 (0.9%) |
63.19 |
62.32 - 64.31 |
1.4722 times |
Mon 01 December 2025 |
63.11 (-1.1%) |
63.35 |
62.43 - 63.99 |
1.1929 times |
Fri 28 November 2025 |
63.81 (-0.06%) |
64.00 |
63.33 - 64.00 |
0.3993 times |
Wed 26 November 2025 |
63.85 (0.85%) |
63.00 |
62.60 - 64.08 |
0.5587 times |
Tue 25 November 2025 |
63.31 (4.71%) |
60.41 |
60.33 - 63.70 |
1.5223 times |
Mon 24 November 2025 |
60.46 (9.35%) |
58.50 |
58.30 - 61.48 |
1.7355 times |
Fri 21 November 2025 |
55.29 (3.5%) |
54.15 |
53.48 - 56.16 |
0.6687 times |
Thu 20 November 2025 |
53.42 (-0.91%) |
54.22 |
53.37 - 55.35 |
0.6535 times |
Wed 19 November 2025 |
53.91 (0.04%) |
53.71 |
53.38 - 54.27 |
0.9085 times |
Weekly price and charts LivanovaPlc Strong weekly Stock price targets for LivanovaPlc LIVN are 63.11 and 65.1 | Weekly Target 1 | 61.52 | | Weekly Target 2 | 62.71 | | Weekly Target 3 | 63.51 | | Weekly Target 4 | 64.7 | | Weekly Target 5 | 65.5 |
Weekly price and volumes for Livanova Plc
| Date |
Closing |
Open |
Range |
Volume |
Thu 04 December 2025 |
63.90 (0.14%) |
63.35 |
62.32 - 64.31 |
1.1152 times |
Fri 28 November 2025 |
63.81 (15.41%) |
58.50 |
58.30 - 64.08 |
1.0537 times |
Fri 21 November 2025 |
55.29 (-0.13%) |
55.16 |
52.37 - 56.16 |
1.0208 times |
Fri 14 November 2025 |
55.36 (9.73%) |
50.70 |
49.83 - 57.83 |
1.6175 times |
Fri 07 November 2025 |
50.45 (-4.14%) |
52.52 |
48.82 - 54.95 |
1.5007 times |
Fri 31 October 2025 |
52.63 (0%) |
52.45 |
51.89 - 53.32 |
0.2125 times |
Fri 31 October 2025 |
52.63 (-4.12%) |
54.87 |
51.89 - 55.20 |
1.097 times |
Fri 24 October 2025 |
54.89 (1.65%) |
54.31 |
53.31 - 55.32 |
0.8828 times |
Fri 17 October 2025 |
54.00 (6.53%) |
51.19 |
50.90 - 54.29 |
0.756 times |
Fri 10 October 2025 |
50.69 (-5.02%) |
53.35 |
50.41 - 54.31 |
0.7438 times |
Fri 03 October 2025 |
53.37 (-0.13%) |
53.46 |
49.29 - 53.50 |
1.1267 times |
Monthly price and charts LivanovaPlc Strong monthly Stock price targets for LivanovaPlc LIVN are 63.11 and 65.1 | Monthly Target 1 | 61.52 | | Monthly Target 2 | 62.71 | | Monthly Target 3 | 63.51 | | Monthly Target 4 | 64.7 | | Monthly Target 5 | 65.5 |
Monthly price and volumes Livanova Plc
| Date |
Closing |
Open |
Range |
Volume |
Thu 04 December 2025 |
63.90 (0.14%) |
63.35 |
62.32 - 64.31 |
0.2049 times |
Fri 28 November 2025 |
63.81 (21.24%) |
52.52 |
48.82 - 64.08 |
0.954 times |
Fri 31 October 2025 |
52.63 (0.48%) |
51.23 |
49.29 - 55.32 |
0.7954 times |
Tue 30 September 2025 |
52.38 (-7.08%) |
55.94 |
51.50 - 58.91 |
0.968 times |
Fri 29 August 2025 |
56.37 (33.61%) |
41.84 |
41.02 - 57.05 |
1.2313 times |
Thu 31 July 2025 |
42.19 (-6.29%) |
44.64 |
41.94 - 47.42 |
1.0229 times |
Mon 30 June 2025 |
45.02 (4.09%) |
43.09 |
42.79 - 47.88 |
0.9124 times |
Fri 30 May 2025 |
43.25 (16.89%) |
37.00 |
35.00 - 45.77 |
1.6336 times |
Wed 30 April 2025 |
37.00 (-5.8%) |
39.18 |
32.48 - 39.74 |
1.1428 times |
Mon 31 March 2025 |
39.28 (-5.64%) |
42.23 |
36.85 - 42.75 |
1.1347 times |
Fri 28 February 2025 |
41.63 (-16.66%) |
49.15 |
40.37 - 49.96 |
1.0225 times |
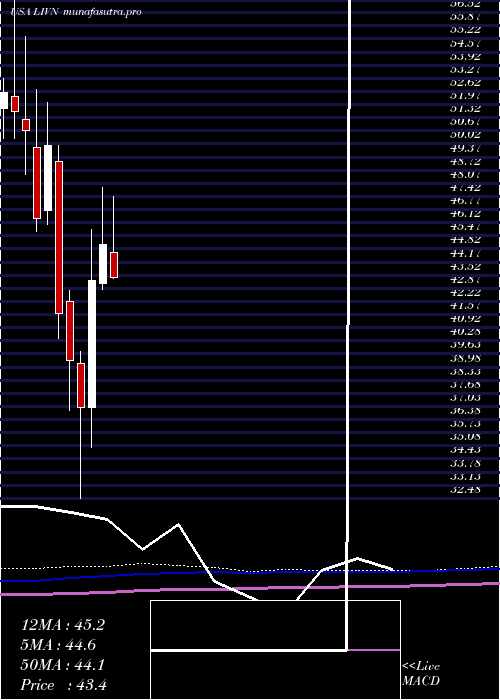
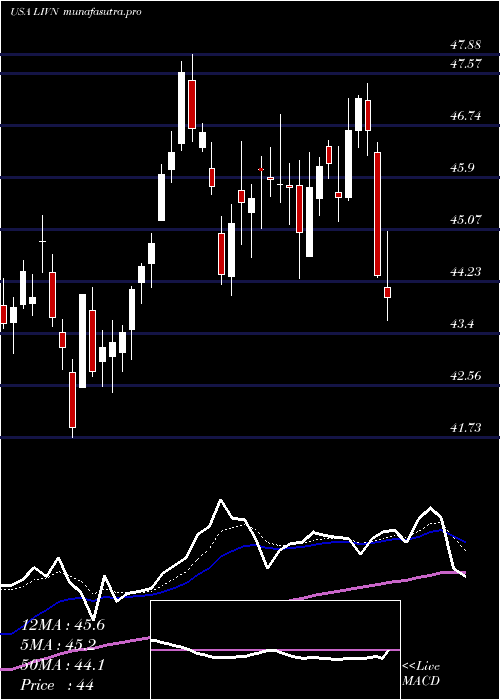
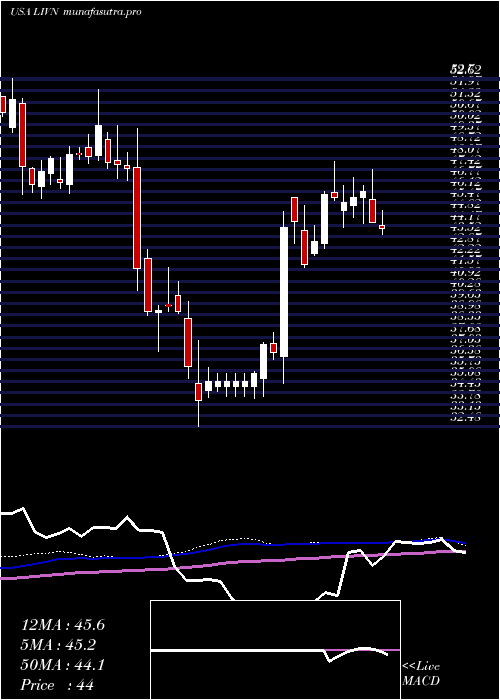
DMA SMA EMA moving averages of Livanova Plc LIVN
DMA (daily moving average) of Livanova Plc LIVN
| DMA period | DMA value | | 5 day DMA | 63.56 | | 12 day DMA | 60.16 | | 20 day DMA | 57.32 | | 35 day DMA | 55.76 | | 50 day DMA | 54.74 | | 100 day DMA | 53.06 | | 150 day DMA | 50.1 | | 200 day DMA | 47.21 | EMA (exponential moving average) of Livanova Plc LIVN
| EMA period | EMA current | EMA prev | EMA prev2 | | 5 day EMA | 63.19 | 62.83 | 62.6 | | 12 day EMA | 60.88 | 60.33 | 59.79 | | 20 day EMA | 58.96 | 58.44 | 57.93 | | 35 day EMA | 57.06 | 56.66 | 56.27 | | 50 day EMA | 55.62 | 55.28 | 54.95 |
SMA (simple moving average) of Livanova Plc LIVN
| SMA period | SMA current | SMA prev | SMA prev2 | | 5 day SMA | 63.56 | 63.55 | 63.55 | | 12 day SMA | 60.16 | 59.31 | 58.64 | | 20 day SMA | 57.32 | 56.66 | 56.19 | | 35 day SMA | 55.76 | 55.46 | 55.16 | | 50 day SMA | 54.74 | 54.53 | 54.34 | | 100 day SMA | 53.06 | 52.86 | 52.66 | | 150 day SMA | 50.1 | 49.92 | 49.75 | | 200 day SMA | 47.21 | 47.13 | 47.05 |
|
|
