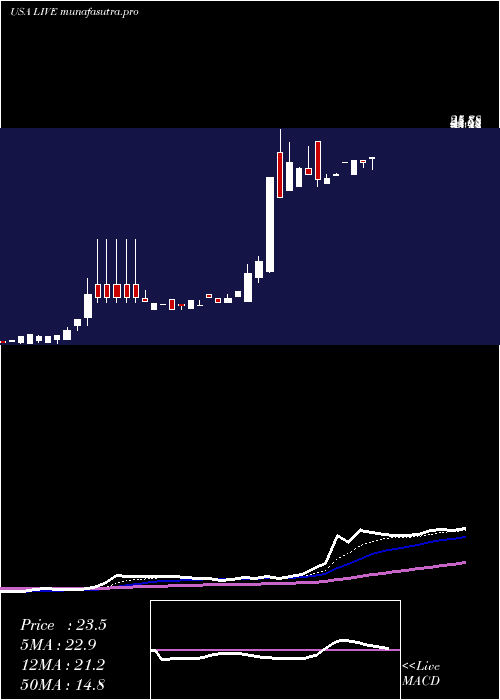
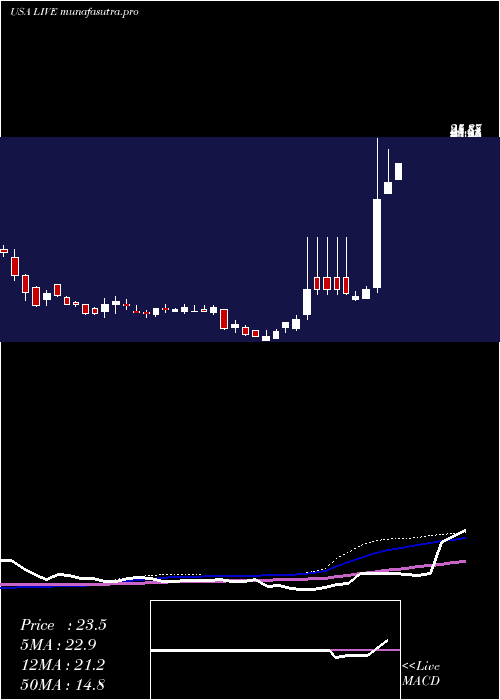
LiveVentures LIVE full analysis,charts,indicators,moving averages,SMA,DMA,EMA,ADX,MACD,RSILive Ventures LIVE WideScreen charts, DMA,SMA,EMA technical analysis, forecast prediction, by indicators ADX,MACD,RSI,CCI USA stock exchange
operates under Finance sector & deals in Finance Investors Services
Daily price and charts and targets LiveVentures Strong Daily Stock price targets for LiveVentures LIVE are 9.72 and 10.2 | Daily Target 1 | 9.62 | | Daily Target 2 | 9.81 | | Daily Target 3 | 10.103333333333 | | Daily Target 4 | 10.29 | | Daily Target 5 | 10.58 |
Daily price and volume Live Ventures
| Date |
Closing |
Open |
Range |
Volume |
Thu 04 December 2025 |
9.99 (-4.13%) |
10.40 |
9.92 - 10.40 |
0.4365 times |
Wed 03 December 2025 |
10.42 (6.98%) |
9.71 |
9.71 - 11.74 |
1.045 times |
Tue 02 December 2025 |
9.74 (-1.12%) |
10.92 |
9.71 - 12.49 |
2.0635 times |
Mon 01 December 2025 |
9.85 (6.49%) |
9.37 |
9.32 - 10.38 |
0.4497 times |
Fri 28 November 2025 |
9.25 (0.33%) |
9.72 |
9.25 - 9.72 |
0.119 times |
Wed 26 November 2025 |
9.22 (0.66%) |
9.93 |
9.19 - 9.93 |
0.9921 times |
Tue 25 November 2025 |
9.16 (-3.27%) |
9.46 |
9.05 - 10.12 |
1.7328 times |
Mon 24 November 2025 |
9.47 (-3.86%) |
10.19 |
9.21 - 10.19 |
1.5344 times |
Fri 21 November 2025 |
9.85 (0%) |
10.50 |
9.72 - 10.50 |
0.4233 times |
Thu 20 November 2025 |
9.85 (-1.6%) |
10.52 |
9.61 - 10.52 |
1.2037 times |
Wed 19 November 2025 |
10.01 (-3%) |
10.70 |
10.01 - 10.70 |
0.2381 times |
Weekly price and charts LiveVentures Strong weekly Stock price targets for LiveVentures LIVE are 9.66 and 12.83 | Weekly Target 1 | 7.43 | | Weekly Target 2 | 8.71 | | Weekly Target 3 | 10.6 | | Weekly Target 4 | 11.88 | | Weekly Target 5 | 13.77 |
Weekly price and volumes for Live Ventures
| Date |
Closing |
Open |
Range |
Volume |
Thu 04 December 2025 |
9.99 (8%) |
9.37 |
9.32 - 12.49 |
0.985 times |
Fri 28 November 2025 |
9.25 (-6.09%) |
10.19 |
9.05 - 10.19 |
1.0796 times |
Fri 21 November 2025 |
9.85 (-11.18%) |
11.02 |
9.61 - 11.04 |
0.8611 times |
Fri 14 November 2025 |
11.09 (-16.74%) |
13.51 |
11.00 - 13.51 |
0.7404 times |
Fri 07 November 2025 |
13.32 (-1.77%) |
14.15 |
12.79 - 14.71 |
0.6849 times |
Fri 31 October 2025 |
13.56 (0%) |
12.75 |
12.75 - 14.18 |
0.1598 times |
Fri 31 October 2025 |
13.56 (-20%) |
16.66 |
12.75 - 16.66 |
1.259 times |
Fri 24 October 2025 |
16.95 (2.79%) |
16.97 |
16.35 - 17.55 |
0.4501 times |
Fri 17 October 2025 |
16.49 (-7.36%) |
17.13 |
16.36 - 18.78 |
1.559 times |
Fri 10 October 2025 |
17.80 (-1.66%) |
17.97 |
17.14 - 18.82 |
2.2211 times |
Fri 03 October 2025 |
18.10 (-1.9%) |
18.31 |
17.55 - 18.86 |
1.6777 times |
Monthly price and charts LiveVentures Strong monthly Stock price targets for LiveVentures LIVE are 9.66 and 12.83 | Monthly Target 1 | 7.43 | | Monthly Target 2 | 8.71 | | Monthly Target 3 | 10.6 | | Monthly Target 4 | 11.88 | | Monthly Target 5 | 13.77 |
Monthly price and volumes Live Ventures
| Date |
Closing |
Open |
Range |
Volume |
Thu 04 December 2025 |
9.99 (8%) |
9.37 |
9.32 - 12.49 |
0.0438 times |
Fri 28 November 2025 |
9.25 (-31.78%) |
14.15 |
9.05 - 14.71 |
0.1498 times |
Fri 31 October 2025 |
13.56 (-26.18%) |
18.59 |
12.75 - 18.82 |
0.2733 times |
Tue 30 September 2025 |
18.37 (-7.22%) |
19.83 |
14.99 - 23.00 |
0.6219 times |
Fri 29 August 2025 |
19.80 (29.24%) |
15.56 |
13.66 - 25.42 |
1.3091 times |
Thu 31 July 2025 |
15.32 (-11.85%) |
17.98 |
13.23 - 20.55 |
0.7487 times |
Mon 30 June 2025 |
17.38 (-19.8%) |
20.80 |
7.01 - 24.35 |
5.8005 times |
Fri 30 May 2025 |
21.67 (89.92%) |
11.36 |
10.95 - 25.88 |
0.4307 times |
Wed 30 April 2025 |
11.41 (49.54%) |
7.60 |
7.45 - 16.38 |
0.5176 times |
Mon 31 March 2025 |
7.63 (-5.1%) |
7.72 |
6.50 - 7.92 |
0.1046 times |
Fri 28 February 2025 |
8.04 (-13.27%) |
9.46 |
7.32 - 9.86 |
0.1923 times |
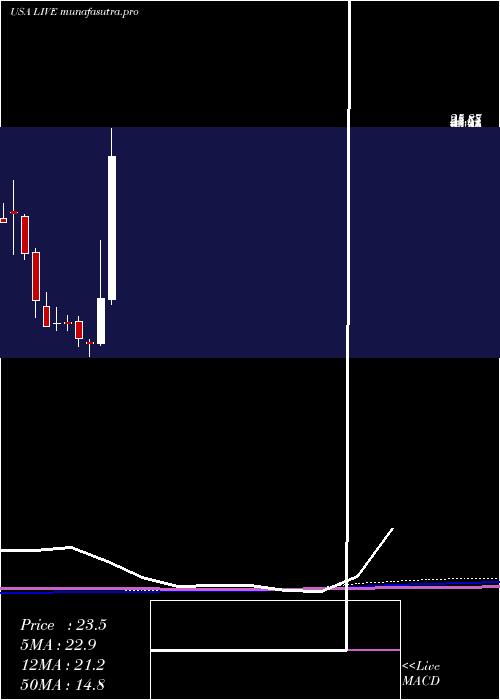
DMA SMA EMA moving averages of Live Ventures LIVE
DMA (daily moving average) of Live Ventures LIVE
| DMA period | DMA value | | 5 day DMA | 9.85 | | 12 day DMA | 9.76 | | 20 day DMA | 10.67 | | 35 day DMA | 12.82 | | 50 day DMA | 14.38 | | 100 day DMA | 15.63 | | 150 day DMA | 16.07 | | 200 day DMA | 14.24 | EMA (exponential moving average) of Live Ventures LIVE
| EMA period | EMA current | EMA prev | EMA prev2 | | 5 day EMA | 9.92 | 9.89 | 9.63 | | 12 day EMA | 10.18 | 10.21 | 10.17 | | 20 day EMA | 10.93 | 11.03 | 11.09 | | 35 day EMA | 12.46 | 12.61 | 12.74 | | 50 day EMA | 14.21 | 14.38 | 14.54 |
SMA (simple moving average) of Live Ventures LIVE
| SMA period | SMA current | SMA prev | SMA prev2 | | 5 day SMA | 9.85 | 9.7 | 9.44 | | 12 day SMA | 9.76 | 9.82 | 9.87 | | 20 day SMA | 10.67 | 10.89 | 11.06 | | 35 day SMA | 12.82 | 13.04 | 13.23 | | 50 day SMA | 14.38 | 14.53 | 14.68 | | 100 day SMA | 15.63 | 15.67 | 15.72 | | 150 day SMA | 16.07 | 16.08 | 16.08 | | 200 day SMA | 14.24 | 14.24 | 14.24 |
|
|
