LightintheboxHolding LITB full analysis,charts,indicators,moving averages,SMA,DMA,EMA,ADX,MACD,RSILightinthebox Holding LITB WideScreen charts, DMA,SMA,EMA technical analysis, forecast prediction, by indicators ADX,MACD,RSI,CCI USA stock exchange
operates under Consumer Services sector & deals in Catalog Specialty Distribution
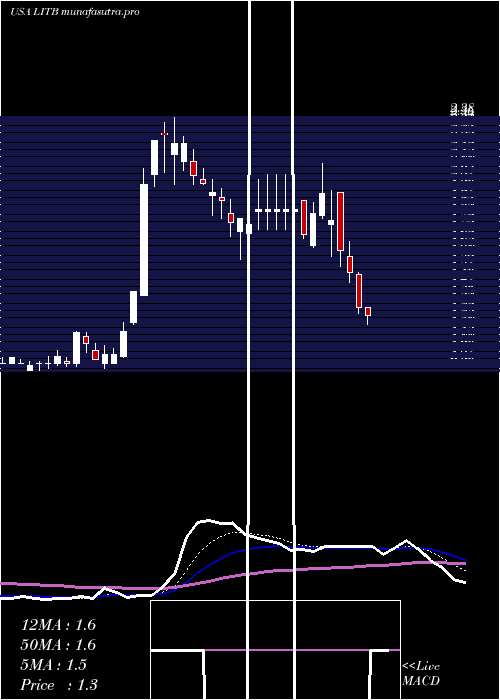
Daily price and charts and targets LightintheboxHolding Strong Daily Stock price targets for LightintheboxHolding LITB are 1.88 and 2.06 | Daily Target 1 | 1.85 | | Daily Target 2 | 1.91 | | Daily Target 3 | 2.03 | | Daily Target 4 | 2.09 | | Daily Target 5 | 2.21 |
Daily price and volume Lightinthebox Holding
| Date |
Closing |
Open |
Range |
Volume |
Thu 04 December 2025 |
1.97 (-3.9%) |
2.10 |
1.97 - 2.15 |
2.377 times |
Wed 03 December 2025 |
2.05 (1.99%) |
2.07 |
2.01 - 2.18 |
1.4754 times |
Tue 02 December 2025 |
2.01 (1.52%) |
2.00 |
1.99 - 2.10 |
0.6352 times |
Mon 01 December 2025 |
1.98 (3.66%) |
1.98 |
1.93 - 2.03 |
1.0041 times |
Fri 28 November 2025 |
1.91 (-1.04%) |
1.86 |
1.86 - 2.10 |
0.3893 times |
Wed 26 November 2025 |
1.93 (-2.53%) |
1.90 |
1.90 - 1.99 |
0.6352 times |
Tue 25 November 2025 |
1.98 (0.51%) |
1.90 |
1.90 - 1.98 |
0.2459 times |
Mon 24 November 2025 |
1.97 (2.6%) |
1.94 |
1.82 - 1.97 |
0.8197 times |
Fri 21 November 2025 |
1.92 (1.59%) |
1.83 |
1.83 - 1.95 |
0.3074 times |
Thu 20 November 2025 |
1.89 (1.07%) |
1.87 |
1.82 - 1.97 |
2.1107 times |
Wed 19 November 2025 |
1.87 (-2.09%) |
1.84 |
1.81 - 1.89 |
1.9877 times |
Weekly price and charts LightintheboxHolding Strong weekly Stock price targets for LightintheboxHolding LITB are 1.83 and 2.08 | Weekly Target 1 | 1.78 | | Weekly Target 2 | 1.87 | | Weekly Target 3 | 2.0266666666667 | | Weekly Target 4 | 2.12 | | Weekly Target 5 | 2.28 |
Weekly price and volumes for Lightinthebox Holding
| Date |
Closing |
Open |
Range |
Volume |
Thu 04 December 2025 |
1.97 (3.14%) |
1.98 |
1.93 - 2.18 |
0.3048 times |
Fri 28 November 2025 |
1.91 (-0.52%) |
1.94 |
1.82 - 2.10 |
0.116 times |
Fri 21 November 2025 |
1.92 (-5.42%) |
2.07 |
1.80 - 2.07 |
0.5561 times |
Fri 14 November 2025 |
2.03 (-33%) |
3.08 |
2.02 - 3.26 |
0.5913 times |
Fri 07 November 2025 |
3.03 (-18.55%) |
3.48 |
2.79 - 3.70 |
0.6789 times |
Fri 31 October 2025 |
3.72 (0%) |
3.67 |
3.61 - 3.93 |
0.2991 times |
Fri 31 October 2025 |
3.72 (26.1%) |
2.86 |
2.77 - 4.17 |
1.7603 times |
Fri 24 October 2025 |
2.95 (20.9%) |
2.39 |
2.26 - 3.40 |
3.2341 times |
Fri 17 October 2025 |
2.44 (23.86%) |
2.00 |
1.85 - 2.51 |
1.5079 times |
Fri 10 October 2025 |
1.97 (0%) |
2.03 |
1.88 - 2.06 |
0.9515 times |
Fri 03 October 2025 |
1.97 (3.14%) |
1.92 |
1.90 - 2.15 |
1.6599 times |

Monthly price and charts LightintheboxHolding Strong monthly Stock price targets for LightintheboxHolding LITB are 1.83 and 2.08 | Monthly Target 1 | 1.78 | | Monthly Target 2 | 1.87 | | Monthly Target 3 | 2.0266666666667 | | Monthly Target 4 | 2.12 | | Monthly Target 5 | 2.28 |
Monthly price and volumes Lightinthebox Holding
| Date |
Closing |
Open |
Range |
Volume |
Thu 04 December 2025 |
1.97 (3.14%) |
1.98 |
1.93 - 2.18 |
0.0451 times |
Fri 28 November 2025 |
1.91 (-48.66%) |
3.48 |
1.80 - 3.70 |
0.2877 times |
Fri 31 October 2025 |
3.72 (77.14%) |
2.05 |
1.85 - 4.17 |
1.2754 times |
Tue 30 September 2025 |
2.10 (75%) |
1.17 |
1.17 - 2.32 |
2.7118 times |
Fri 29 August 2025 |
1.20 (-2.44%) |
1.22 |
1.15 - 1.42 |
0.4233 times |
Thu 31 July 2025 |
1.23 (6.96%) |
1.19 |
1.11 - 1.49 |
0.3231 times |
Mon 30 June 2025 |
1.15 (-4.96%) |
1.21 |
1.07 - 1.32 |
0.3212 times |
Fri 30 May 2025 |
1.21 (-4.72%) |
1.28 |
1.06 - 1.49 |
0.5732 times |
Wed 30 April 2025 |
1.27 (-36.5%) |
2.06 |
1.22 - 2.38 |
1.7644 times |
Mon 31 March 2025 |
2.00 (96.08%) |
1.00 |
0.92 - 2.09 |
2.2748 times |
Fri 28 February 2025 |
1.02 (-12.07%) |
1.07 |
0.91 - 1.19 |
0.6537 times |

DMA SMA EMA moving averages of Lightinthebox Holding LITB
DMA (daily moving average) of Lightinthebox Holding LITB
| DMA period | DMA value | | 5 day DMA | 1.98 | | 12 day DMA | 1.95 | | 20 day DMA | 2.21 | | 35 day DMA | 2.6 | | 50 day DMA | 2.42 | | 100 day DMA | 1.95 | | 150 day DMA | 1.71 | | 200 day DMA | 1.65 | EMA (exponential moving average) of Lightinthebox Holding LITB
| EMA period | EMA current | EMA prev | EMA prev2 | | 5 day EMA | 1.99 | 2 | 1.97 | | 12 day EMA | 2.06 | 2.08 | 2.08 | | 20 day EMA | 2.19 | 2.21 | 2.23 | | 35 day EMA | 2.23 | 2.25 | 2.26 | | 50 day EMA | 2.35 | 2.37 | 2.38 |
SMA (simple moving average) of Lightinthebox Holding LITB
| SMA period | SMA current | SMA prev | SMA prev2 | | 5 day SMA | 1.98 | 1.98 | 1.96 | | 12 day SMA | 1.95 | 1.94 | 1.94 | | 20 day SMA | 2.21 | 2.27 | 2.33 | | 35 day SMA | 2.6 | 2.6 | 2.6 | | 50 day SMA | 2.42 | 2.42 | 2.42 | | 100 day SMA | 1.95 | 1.95 | 1.94 | | 150 day SMA | 1.71 | 1.7 | 1.7 | | 200 day SMA | 1.65 | 1.64 | 1.64 |
|
|
