FidelitySouthern LION full analysis,charts,indicators,moving averages,SMA,DMA,EMA,ADX,MACD,RSIFidelity Southern LION WideScreen charts, DMA,SMA,EMA technical analysis, forecast prediction, by indicators ADX,MACD,RSI,CCI USA stock exchange
operates under Finance sector & deals in Major Banks
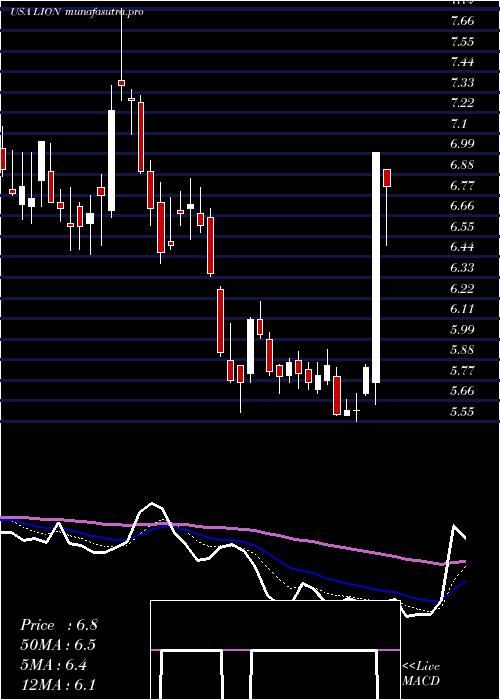
Daily price and charts and targets FidelitySouthern Strong Daily Stock price targets for FidelitySouthern LION are 6.94 and 7.2 | Daily Target 1 | 6.88 | | Daily Target 2 | 6.99 | | Daily Target 3 | 7.14 | | Daily Target 4 | 7.25 | | Daily Target 5 | 7.4 |
Daily price and volume Fidelity Southern
| Date |
Closing |
Open |
Range |
Volume |
Thu 04 December 2025 |
7.10 (-1.11%) |
7.16 |
7.03 - 7.29 |
1.0962 times |
Wed 03 December 2025 |
7.18 (-3.36%) |
7.40 |
7.16 - 7.45 |
0.8242 times |
Tue 02 December 2025 |
7.43 (1.23%) |
7.39 |
7.23 - 7.50 |
1.49 times |
Mon 01 December 2025 |
7.34 (-1.61%) |
7.42 |
7.27 - 7.53 |
1.1794 times |
Fri 28 November 2025 |
7.46 (1.77%) |
7.29 |
7.27 - 7.50 |
0.4928 times |
Wed 26 November 2025 |
7.33 (2.09%) |
7.18 |
7.14 - 7.39 |
0.8482 times |
Tue 25 November 2025 |
7.18 (0.84%) |
7.08 |
7.04 - 7.27 |
0.749 times |
Mon 24 November 2025 |
7.12 (0%) |
7.31 |
7.11 - 7.37 |
0.885 times |
Fri 21 November 2025 |
7.12 (4.55%) |
6.88 |
6.71 - 7.18 |
1.1925 times |
Thu 20 November 2025 |
6.81 (-0.29%) |
6.95 |
6.75 - 7.05 |
1.2426 times |
Wed 19 November 2025 |
6.83 (-1.01%) |
6.93 |
6.80 - 6.99 |
1.1371 times |
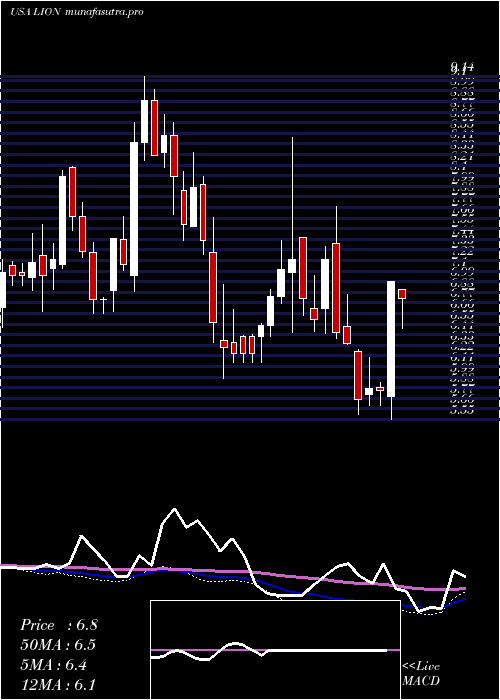
Weekly price and charts FidelitySouthern Strong weekly Stock price targets for FidelitySouthern LION are 6.82 and 7.32 | Weekly Target 1 | 6.72 | | Weekly Target 2 | 6.91 | | Weekly Target 3 | 7.22 | | Weekly Target 4 | 7.41 | | Weekly Target 5 | 7.72 |
Weekly price and volumes for Fidelity Southern
| Date |
Closing |
Open |
Range |
Volume |
Thu 04 December 2025 |
7.10 (-4.83%) |
7.42 |
7.03 - 7.53 |
0.905 times |
Fri 28 November 2025 |
7.46 (4.78%) |
7.31 |
7.04 - 7.50 |
0.5866 times |
Fri 21 November 2025 |
7.12 (7.23%) |
6.67 |
6.47 - 7.18 |
1.2732 times |
Fri 14 November 2025 |
6.64 (-3.35%) |
6.87 |
6.51 - 7.12 |
0.9983 times |
Fri 07 November 2025 |
6.87 (6.84%) |
6.49 |
6.33 - 7.10 |
1.2488 times |
Fri 31 October 2025 |
6.43 (0%) |
6.28 |
6.18 - 6.53 |
0.2078 times |
Fri 31 October 2025 |
6.43 (-0.62%) |
6.48 |
6.14 - 6.57 |
0.7757 times |
Fri 24 October 2025 |
6.47 (9.48%) |
5.97 |
5.90 - 6.59 |
1.3952 times |
Fri 17 October 2025 |
5.91 (-1.01%) |
6.02 |
5.88 - 6.29 |
1.3014 times |
Fri 10 October 2025 |
5.97 (-9.82%) |
6.73 |
5.96 - 6.77 |
1.308 times |
Fri 03 October 2025 |
6.62 (-5.43%) |
7.00 |
6.50 - 7.13 |
1.2253 times |
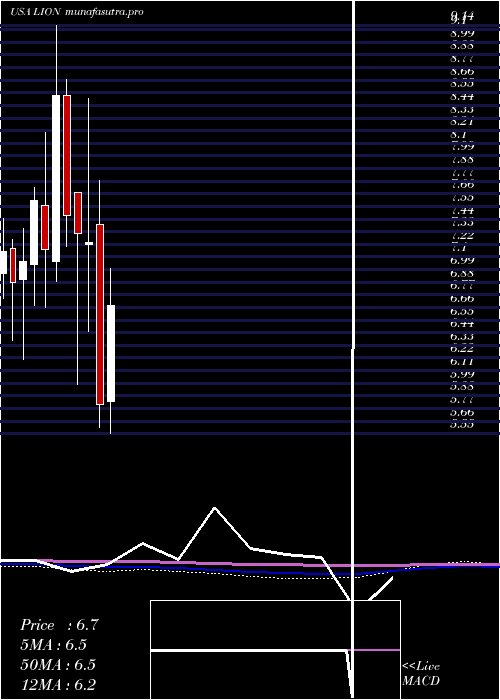
Monthly price and charts FidelitySouthern Strong monthly Stock price targets for FidelitySouthern LION are 6.82 and 7.32 | Monthly Target 1 | 6.72 | | Monthly Target 2 | 6.91 | | Monthly Target 3 | 7.22 | | Monthly Target 4 | 7.41 | | Monthly Target 5 | 7.72 |
Monthly price and volumes Fidelity Southern
| Date |
Closing |
Open |
Range |
Volume |
Thu 04 December 2025 |
7.10 (-4.83%) |
7.42 |
7.03 - 7.53 |
0.2088 times |
Fri 28 November 2025 |
7.46 (16.02%) |
6.49 |
6.33 - 7.50 |
0.9476 times |
Fri 31 October 2025 |
6.43 (-6.81%) |
6.88 |
5.88 - 7.09 |
1.3304 times |
Tue 30 September 2025 |
6.90 (7.31%) |
6.34 |
6.10 - 7.69 |
1.6853 times |
Fri 29 August 2025 |
6.43 (8.61%) |
6.00 |
5.65 - 6.65 |
1.2787 times |
Thu 31 July 2025 |
5.92 (1.89%) |
5.83 |
5.55 - 7.00 |
1.4209 times |
Mon 30 June 2025 |
5.81 (-19.64%) |
7.39 |
5.60 - 7.78 |
1.3199 times |
Fri 30 May 2025 |
7.23 (-1.09%) |
7.21 |
6.45 - 8.50 |
1.4991 times |
Wed 30 April 2025 |
7.31 (-2.14%) |
7.67 |
5.98 - 7.67 |
0.1948 times |
Mon 31 March 2025 |
7.47 (-12.32%) |
8.52 |
7.20 - 8.66 |
0.1146 times |
Fri 28 February 2025 |
8.52 (18.83%) |
7.06 |
6.89 - 9.14 |
0.1654 times |
DMA SMA EMA moving averages of Fidelity Southern LION
DMA (daily moving average) of Fidelity Southern LION
| DMA period | DMA value | | 5 day DMA | 7.3 | | 12 day DMA | 7.15 | | 20 day DMA | 7.01 | | 35 day DMA | 6.71 | | 50 day DMA | 6.63 | | 100 day DMA | 6.55 | | 150 day DMA | 6.55 | | 200 day DMA | 6.78 | EMA (exponential moving average) of Fidelity Southern LION
| EMA period | EMA current | EMA prev | EMA prev2 | | 5 day EMA | 7.22 | 7.28 | 7.33 | | 12 day EMA | 7.14 | 7.15 | 7.14 | | 20 day EMA | 7.02 | 7.01 | 6.99 | | 35 day EMA | 6.87 | 6.86 | 6.84 | | 50 day EMA | 6.72 | 6.7 | 6.68 |
SMA (simple moving average) of Fidelity Southern LION
| SMA period | SMA current | SMA prev | SMA prev2 | | 5 day SMA | 7.3 | 7.35 | 7.35 | | 12 day SMA | 7.15 | 7.11 | 7.07 | | 20 day SMA | 7.01 | 6.99 | 6.95 | | 35 day SMA | 6.71 | 6.68 | 6.65 | | 50 day SMA | 6.63 | 6.63 | 6.62 | | 100 day SMA | 6.55 | 6.55 | 6.55 | | 150 day SMA | 6.55 | 6.56 | 6.56 | | 200 day SMA | 6.78 | 6.79 | 6.8 |
|
|
