LindePlc LIN full analysis,charts,indicators,moving averages,SMA,DMA,EMA,ADX,MACD,RSILinde Plc LIN WideScreen charts, DMA,SMA,EMA technical analysis, forecast prediction, by indicators ADX,MACD,RSI,CCI USA stock exchange
operates under Basic Industries sector & deals in Major Chemicals
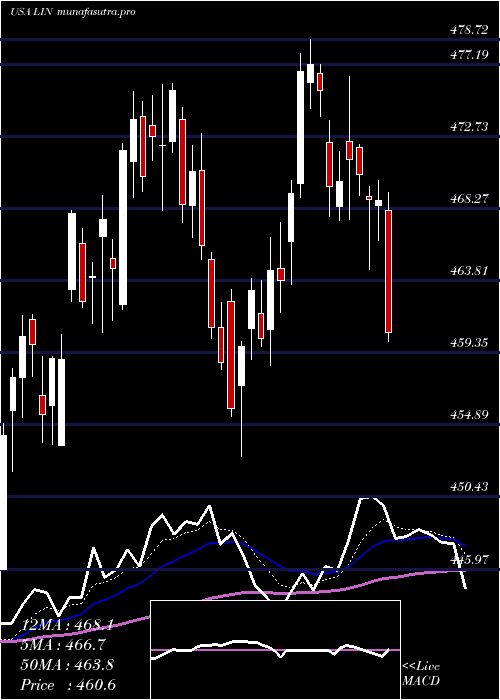
Daily price and charts and targets LindePlc Strong Daily Stock price targets for LindePlc LIN are 399.43 and 406.23 | Daily Target 1 | 398 | | Daily Target 2 | 400.86 | | Daily Target 3 | 404.79666666667 | | Daily Target 4 | 407.66 | | Daily Target 5 | 411.6 |
Daily price and volume Linde Plc
| Date |
Closing |
Open |
Range |
Volume |
Thu 04 December 2025 |
403.73 (-1.32%) |
407.61 |
401.93 - 408.73 |
1.2326 times |
Wed 03 December 2025 |
409.15 (0.09%) |
408.34 |
406.00 - 411.02 |
0.8437 times |
Tue 02 December 2025 |
408.79 (0.41%) |
408.00 |
404.27 - 411.32 |
0.9222 times |
Mon 01 December 2025 |
407.14 (-0.78%) |
410.02 |
406.72 - 411.57 |
0.8944 times |
Fri 28 November 2025 |
410.32 (0.59%) |
407.82 |
406.47 - 411.58 |
0.5003 times |
Wed 26 November 2025 |
407.90 (0.01%) |
407.50 |
407.02 - 410.49 |
1.117 times |
Tue 25 November 2025 |
407.85 (0.06%) |
411.67 |
406.09 - 412.87 |
1.543 times |
Mon 24 November 2025 |
407.60 (-1.25%) |
412.43 |
406.71 - 413.85 |
0.4369 times |
Fri 21 November 2025 |
412.74 (1.04%) |
407.38 |
406.42 - 416.42 |
1.3361 times |
Thu 20 November 2025 |
408.51 (-1.14%) |
414.60 |
408.21 - 415.95 |
1.1739 times |
Wed 19 November 2025 |
413.20 (-0.37%) |
414.73 |
410.73 - 416.07 |
1.1359 times |
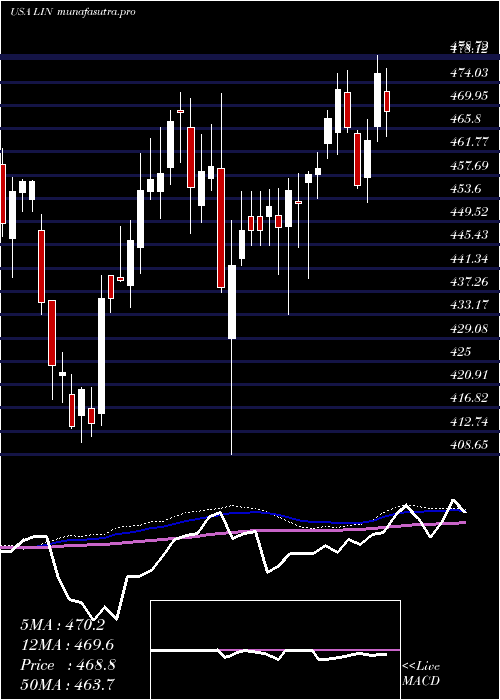
Weekly price and charts LindePlc Strong weekly Stock price targets for LindePlc LIN are 398.01 and 407.65 | Weekly Target 1 | 396.1 | | Weekly Target 2 | 399.92 | | Weekly Target 3 | 405.74333333333 | | Weekly Target 4 | 409.56 | | Weekly Target 5 | 415.38 |
Weekly price and volumes for Linde Plc
| Date |
Closing |
Open |
Range |
Volume |
Thu 04 December 2025 |
403.73 (-1.61%) |
410.02 |
401.93 - 411.57 |
0.9098 times |
Fri 28 November 2025 |
410.32 (-0.59%) |
412.43 |
406.09 - 413.85 |
0.8407 times |
Fri 21 November 2025 |
412.74 (-2.52%) |
421.61 |
406.42 - 423.38 |
1.3392 times |
Fri 14 November 2025 |
423.39 (0.68%) |
420.52 |
415.92 - 431.56 |
1.3134 times |
Fri 07 November 2025 |
420.51 (0.53%) |
416.17 |
413.59 - 422.82 |
0.9541 times |
Fri 31 October 2025 |
418.30 (0%) |
425.00 |
414.47 - 426.41 |
0.4103 times |
Fri 31 October 2025 |
418.30 (-6.21%) |
447.65 |
414.47 - 450.15 |
1.6362 times |
Fri 24 October 2025 |
446.00 (-1.08%) |
452.36 |
445.59 - 455.24 |
0.8702 times |
Fri 17 October 2025 |
450.89 (-0.65%) |
456.56 |
440.95 - 462.07 |
1.0264 times |
Fri 10 October 2025 |
453.82 (-2.77%) |
466.64 |
452.92 - 471.69 |
0.6996 times |
Fri 03 October 2025 |
466.73 (-1.62%) |
474.74 |
460.80 - 478.78 |
0.863 times |
Monthly price and charts LindePlc Strong monthly Stock price targets for LindePlc LIN are 398.01 and 407.65 | Monthly Target 1 | 396.1 | | Monthly Target 2 | 399.92 | | Monthly Target 3 | 405.74333333333 | | Monthly Target 4 | 409.56 | | Monthly Target 5 | 415.38 |
Monthly price and volumes Linde Plc
| Date |
Closing |
Open |
Range |
Volume |
Thu 04 December 2025 |
403.73 (-1.61%) |
410.02 |
401.93 - 411.57 |
0.2359 times |
Fri 28 November 2025 |
410.32 (-1.91%) |
416.17 |
406.09 - 431.56 |
1.1532 times |
Fri 31 October 2025 |
418.30 (-11.94%) |
472.78 |
414.47 - 475.08 |
1.3223 times |
Tue 30 September 2025 |
475.00 (-0.69%) |
477.17 |
466.59 - 484.44 |
0.9696 times |
Fri 29 August 2025 |
478.29 (3.92%) |
458.33 |
449.32 - 486.38 |
0.8795 times |
Thu 31 July 2025 |
460.26 (-1.9%) |
469.79 |
456.00 - 478.72 |
0.8564 times |
Mon 30 June 2025 |
469.18 (0.34%) |
465.17 |
452.95 - 476.00 |
0.962 times |
Fri 30 May 2025 |
467.58 (3.17%) |
437.44 |
433.15 - 469.10 |
1.0638 times |
Wed 30 April 2025 |
453.23 (-2.67%) |
462.00 |
408.65 - 472.01 |
1.2956 times |
Mon 31 March 2025 |
465.64 (-0.3%) |
469.10 |
447.50 - 472.23 |
1.2617 times |
Fri 28 February 2025 |
467.05 (4.69%) |
445.03 |
440.46 - 468.99 |
1.0323 times |
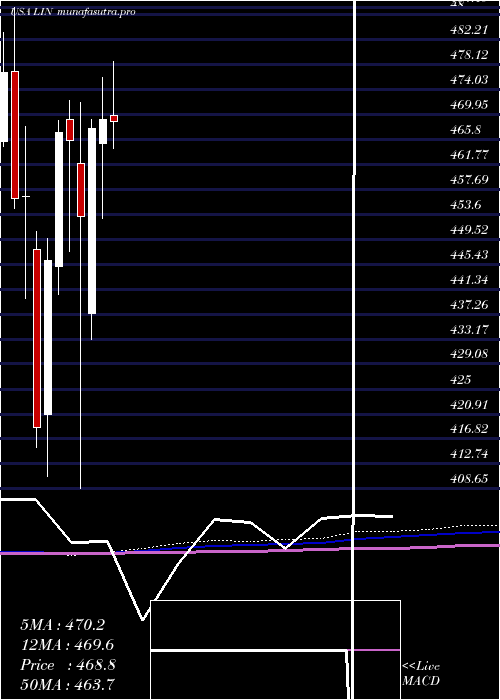
DMA SMA EMA moving averages of Linde Plc LIN
DMA (daily moving average) of Linde Plc LIN
| DMA period | DMA value | | 5 day DMA | 407.83 | | 12 day DMA | 409.3 | | 20 day DMA | 414.68 | | 35 day DMA | 424.53 | | 50 day DMA | 436.91 | | 100 day DMA | 455.45 | | 150 day DMA | 457.95 | | 200 day DMA | 457.15 | EMA (exponential moving average) of Linde Plc LIN
| EMA period | EMA current | EMA prev | EMA prev2 | | 5 day EMA | 407.24 | 408.99 | 408.91 | | 12 day EMA | 410.52 | 411.76 | 412.23 | | 20 day EMA | 415.3 | 416.52 | 417.3 | | 35 day EMA | 426.29 | 427.62 | 428.71 | | 50 day EMA | 437.31 | 438.68 | 439.89 |
SMA (simple moving average) of Linde Plc LIN
| SMA period | SMA current | SMA prev | SMA prev2 | | 5 day SMA | 407.83 | 408.66 | 408.4 | | 12 day SMA | 409.3 | 410.48 | 411.67 | | 20 day SMA | 414.68 | 415.41 | 415.84 | | 35 day SMA | 424.53 | 425.89 | 427.32 | | 50 day SMA | 436.91 | 438.32 | 439.74 | | 100 day SMA | 455.45 | 456.02 | 456.62 | | 150 day SMA | 457.95 | 458.28 | 458.56 | | 200 day SMA | 457.15 | 457.41 | 457.67 |
|
|
