LifevantageCorporation LFVN full analysis,charts,indicators,moving averages,SMA,DMA,EMA,ADX,MACD,RSILifevantage Corporation LFVN WideScreen charts, DMA,SMA,EMA technical analysis, forecast prediction, by indicators ADX,MACD,RSI,CCI USA stock exchange
operates under Health Care sector & deals in Major Pharmaceuticals
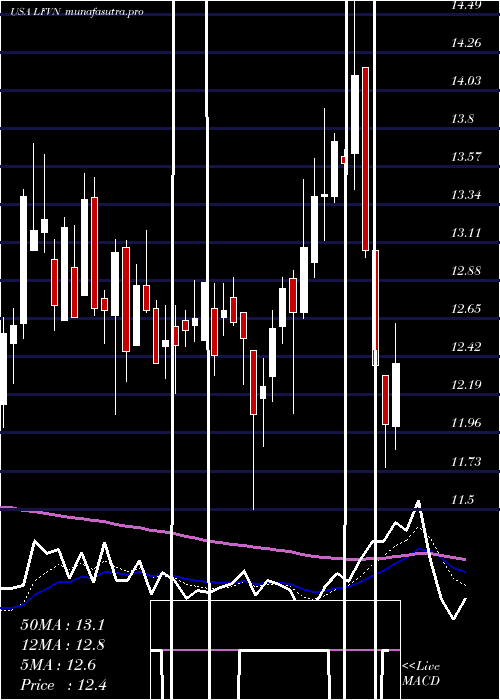
Daily price and charts and targets LifevantageCorporation Strong Daily Stock price targets for LifevantageCorporation LFVN are 6.86 and 7.27 | Daily Target 1 | 6.54 | | Daily Target 2 | 6.76 | | Daily Target 3 | 6.9533333333333 | | Daily Target 4 | 7.17 | | Daily Target 5 | 7.36 |
Daily price and volume Lifevantage Corporation
| Date |
Closing |
Open |
Range |
Volume |
Thu 04 December 2025 |
6.97 (1.6%) |
6.81 |
6.74 - 7.15 |
1.2621 times |
Wed 03 December 2025 |
6.86 (5.86%) |
6.49 |
6.49 - 6.94 |
0.8523 times |
Tue 02 December 2025 |
6.48 (-2.26%) |
6.67 |
6.45 - 6.68 |
0.7772 times |
Mon 01 December 2025 |
6.63 (-3.49%) |
6.81 |
6.58 - 6.90 |
1.2348 times |
Fri 28 November 2025 |
6.87 (1.63%) |
6.79 |
6.79 - 6.97 |
0.5776 times |
Wed 26 November 2025 |
6.76 (-0.15%) |
6.77 |
6.50 - 6.78 |
1.1818 times |
Tue 25 November 2025 |
6.77 (3.52%) |
6.56 |
6.47 - 6.82 |
0.9618 times |
Mon 24 November 2025 |
6.54 (1.71%) |
6.43 |
6.38 - 6.66 |
1.0237 times |
Fri 21 November 2025 |
6.43 (1.9%) |
6.33 |
6.28 - 6.68 |
1.225 times |
Thu 20 November 2025 |
6.31 (-1.41%) |
6.40 |
6.28 - 6.68 |
0.9036 times |
Wed 19 November 2025 |
6.40 (-1.23%) |
6.53 |
6.24 - 6.57 |
1.2401 times |
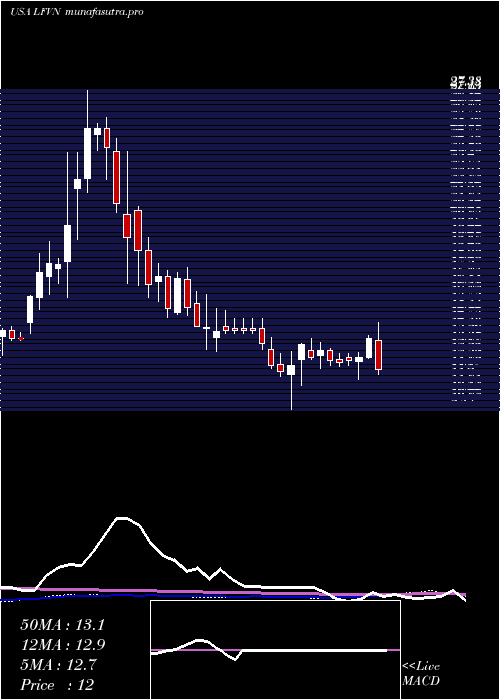
Weekly price and charts LifevantageCorporation Strong weekly Stock price targets for LifevantageCorporation LFVN are 6.71 and 7.41 | Weekly Target 1 | 6.16 | | Weekly Target 2 | 6.56 | | Weekly Target 3 | 6.8566666666667 | | Weekly Target 4 | 7.26 | | Weekly Target 5 | 7.56 |
Weekly price and volumes for Lifevantage Corporation
| Date |
Closing |
Open |
Range |
Volume |
Thu 04 December 2025 |
6.97 (1.46%) |
6.81 |
6.45 - 7.15 |
0.7332 times |
Fri 28 November 2025 |
6.87 (6.84%) |
6.43 |
6.38 - 6.97 |
0.6654 times |
Fri 21 November 2025 |
6.43 (-2.87%) |
6.68 |
5.98 - 6.68 |
1.5604 times |
Fri 14 November 2025 |
6.62 (-10.54%) |
7.45 |
6.38 - 7.47 |
1.4065 times |
Fri 07 November 2025 |
7.40 (-9.65%) |
7.34 |
6.60 - 7.60 |
1.6888 times |
Fri 31 October 2025 |
8.19 (0%) |
8.05 |
8.05 - 8.31 |
0.1303 times |
Fri 31 October 2025 |
8.19 (-5.54%) |
8.73 |
8.05 - 8.94 |
0.9204 times |
Fri 24 October 2025 |
8.67 (-1.59%) |
8.87 |
8.49 - 9.00 |
0.8473 times |
Fri 17 October 2025 |
8.81 (-1.67%) |
9.06 |
8.63 - 9.33 |
0.9873 times |
Fri 10 October 2025 |
8.96 (-5.49%) |
9.48 |
8.87 - 9.63 |
1.0603 times |
Fri 03 October 2025 |
9.48 (-6.97%) |
10.26 |
9.44 - 10.28 |
1.1388 times |
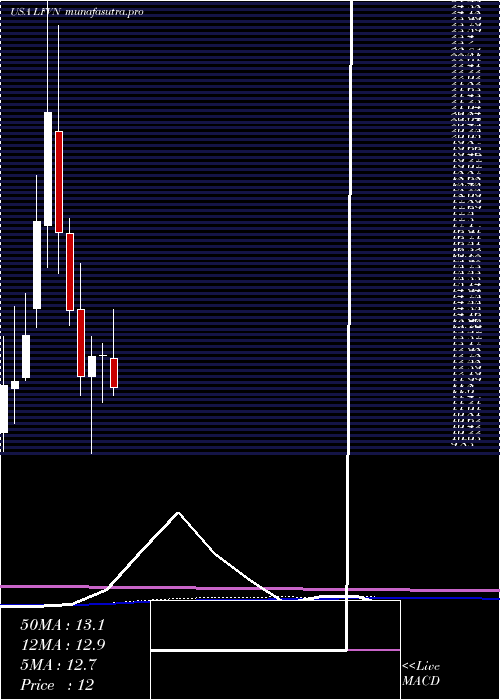
Monthly price and charts LifevantageCorporation Strong monthly Stock price targets for LifevantageCorporation LFVN are 6.71 and 7.41 | Monthly Target 1 | 6.16 | | Monthly Target 2 | 6.56 | | Monthly Target 3 | 6.8566666666667 | | Monthly Target 4 | 7.26 | | Monthly Target 5 | 7.56 |
Monthly price and volumes Lifevantage Corporation
| Date |
Closing |
Open |
Range |
Volume |
Thu 04 December 2025 |
6.97 (1.46%) |
6.81 |
6.45 - 7.15 |
0.155 times |
Fri 28 November 2025 |
6.87 (-16.12%) |
7.34 |
5.98 - 7.60 |
1.125 times |
Fri 31 October 2025 |
8.19 (-15.83%) |
9.69 |
8.05 - 9.84 |
0.9458 times |
Tue 30 September 2025 |
9.73 (-25.73%) |
12.96 |
9.66 - 14.28 |
1.3905 times |
Fri 29 August 2025 |
13.10 (4.38%) |
12.40 |
12.07 - 15.00 |
0.659 times |
Thu 31 July 2025 |
12.55 (-4.05%) |
12.99 |
11.75 - 14.91 |
1.0159 times |
Mon 30 June 2025 |
13.08 (0.23%) |
13.08 |
11.50 - 13.49 |
1.1226 times |
Fri 30 May 2025 |
13.05 (5.5%) |
12.37 |
9.83 - 13.71 |
1.4755 times |
Wed 30 April 2025 |
12.37 (-15.16%) |
14.61 |
11.74 - 16.14 |
1.0536 times |
Mon 31 March 2025 |
14.58 (-15.08%) |
17.14 |
14.09 - 17.64 |
1.0569 times |
Fri 28 February 2025 |
17.17 (-18.86%) |
20.54 |
15.79 - 24.06 |
2.2291 times |
DMA SMA EMA moving averages of Lifevantage Corporation LFVN
DMA (daily moving average) of Lifevantage Corporation LFVN
| DMA period | DMA value | | 5 day DMA | 6.76 | | 12 day DMA | 6.63 | | 20 day DMA | 6.68 | | 35 day DMA | 7.39 | | 50 day DMA | 8.01 | | 100 day DMA | 10.31 | | 150 day DMA | 11.09 | | 200 day DMA | 12.1 | EMA (exponential moving average) of Lifevantage Corporation LFVN
| EMA period | EMA current | EMA prev | EMA prev2 | | 5 day EMA | 6.78 | 6.69 | 6.61 | | 12 day EMA | 6.75 | 6.71 | 6.68 | | 20 day EMA | 6.92 | 6.91 | 6.92 | | 35 day EMA | 7.45 | 7.48 | 7.52 | | 50 day EMA | 8.09 | 8.14 | 8.19 |
SMA (simple moving average) of Lifevantage Corporation LFVN
| SMA period | SMA current | SMA prev | SMA prev2 | | 5 day SMA | 6.76 | 6.72 | 6.7 | | 12 day SMA | 6.63 | 6.57 | 6.55 | | 20 day SMA | 6.68 | 6.69 | 6.7 | | 35 day SMA | 7.39 | 7.45 | 7.51 | | 50 day SMA | 8.01 | 8.07 | 8.15 | | 100 day SMA | 10.31 | 10.37 | 10.42 | | 150 day SMA | 11.09 | 11.12 | 11.16 | | 200 day SMA | 12.1 | 12.16 | 12.22 |
|
|
