LennarCorporation LEN full analysis,charts,indicators,moving averages,SMA,DMA,EMA,ADX,MACD,RSILennar Corporation LEN WideScreen charts, DMA,SMA,EMA technical analysis, forecast prediction, by indicators ADX,MACD,RSI,CCI USA stock exchange
operates under Basic Industries sector & deals in Homebuilding
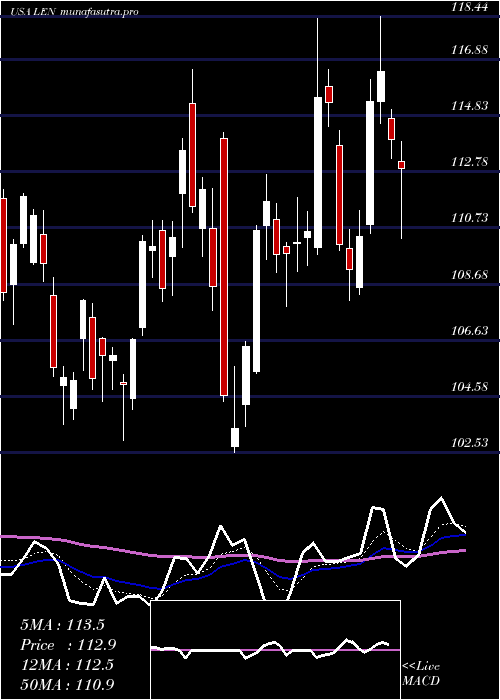
Daily price and charts and targets LennarCorporation Strong Daily Stock price targets for LennarCorporation LEN are 123.47 and 129.99 | Daily Target 1 | 122.38 | | Daily Target 2 | 124.56 | | Daily Target 3 | 128.89666666667 | | Daily Target 4 | 131.08 | | Daily Target 5 | 135.42 |
Daily price and volume Lennar Corporation
| Date |
Closing |
Open |
Range |
Volume |
Thu 04 December 2025 |
126.75 (-4.79%) |
132.62 |
126.71 - 133.23 |
0.2073 times |
Wed 03 December 2025 |
133.13 (2.62%) |
129.73 |
129.22 - 133.76 |
0.5208 times |
Tue 02 December 2025 |
129.73 (-0.38%) |
129.88 |
127.27 - 131.14 |
1.1281 times |
Mon 01 December 2025 |
130.23 (-0.81%) |
129.24 |
129.00 - 132.43 |
1.7354 times |
Fri 28 November 2025 |
131.30 (0.02%) |
130.86 |
129.79 - 131.43 |
0.4413 times |
Wed 26 November 2025 |
131.28 (0.17%) |
131.20 |
130.57 - 132.93 |
1.2206 times |
Tue 25 November 2025 |
131.06 (6.57%) |
123.14 |
122.98 - 131.60 |
0.254 times |
Mon 24 November 2025 |
122.98 (-0.15%) |
123.10 |
120.51 - 124.07 |
0.221 times |
Fri 21 November 2025 |
123.16 (5.94%) |
118.00 |
117.57 - 124.14 |
1.4709 times |
Thu 20 November 2025 |
116.25 (0.95%) |
115.12 |
115.12 - 117.84 |
2.8006 times |
Wed 19 November 2025 |
115.16 (-0.7%) |
116.62 |
114.92 - 116.78 |
1.4691 times |
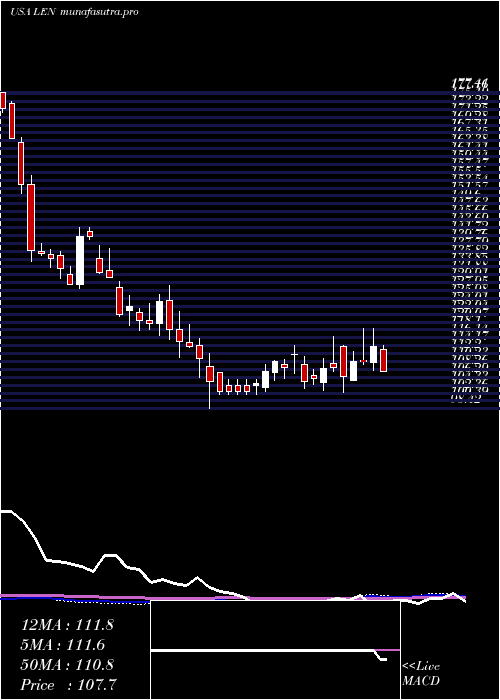
Weekly price and charts LennarCorporation Strong weekly Stock price targets for LennarCorporation LEN are 123.21 and 130.26 | Weekly Target 1 | 122.02 | | Weekly Target 2 | 124.39 | | Weekly Target 3 | 129.07333333333 | | Weekly Target 4 | 131.44 | | Weekly Target 5 | 136.12 |
Weekly price and volumes for Lennar Corporation
| Date |
Closing |
Open |
Range |
Volume |
Thu 04 December 2025 |
126.75 (-3.47%) |
129.24 |
126.71 - 133.76 |
1.731 times |
Fri 28 November 2025 |
131.30 (6.61%) |
123.10 |
120.51 - 132.93 |
1.03 times |
Fri 21 November 2025 |
123.16 (1.69%) |
120.30 |
112.11 - 124.14 |
3.4584 times |
Fri 14 November 2025 |
121.11 (-0.33%) |
121.45 |
120.64 - 126.91 |
0.6532 times |
Fri 07 November 2025 |
121.51 (-1.83%) |
120.66 |
118.94 - 122.87 |
0.4909 times |
Fri 31 October 2025 |
123.77 (0%) |
123.18 |
121.94 - 124.33 |
0.2019 times |
Fri 31 October 2025 |
123.77 (-2.98%) |
128.00 |
121.94 - 130.07 |
0.8619 times |
Fri 24 October 2025 |
127.57 (1.39%) |
126.39 |
122.30 - 130.23 |
0.5853 times |
Fri 17 October 2025 |
125.82 (3.01%) |
117.98 |
117.30 - 125.94 |
0.7621 times |
Tue 07 October 2025 |
122.14 (-6.05%) |
130.07 |
121.65 - 131.25 |
0.2255 times |
Fri 03 October 2025 |
130.00 (3.14%) |
127.44 |
124.50 - 130.83 |
0.4354 times |
Monthly price and charts LennarCorporation Strong monthly Stock price targets for LennarCorporation LEN are 123.21 and 130.26 | Monthly Target 1 | 122.02 | | Monthly Target 2 | 124.39 | | Monthly Target 3 | 129.07333333333 | | Monthly Target 4 | 131.44 | | Monthly Target 5 | 136.12 |
Monthly price and volumes Lennar Corporation
| Date |
Closing |
Open |
Range |
Volume |
Thu 04 December 2025 |
126.75 (-3.47%) |
129.24 |
126.71 - 133.76 |
0.587 times |
Fri 28 November 2025 |
131.30 (6.08%) |
120.66 |
112.11 - 132.93 |
1.91 times |
Fri 31 October 2025 |
123.77 (-1.8%) |
126.50 |
117.30 - 131.25 |
0.9599 times |
Tue 30 September 2025 |
126.04 (-5.33%) |
130.50 |
121.10 - 144.24 |
1.2555 times |
Fri 29 August 2025 |
133.14 (18.68%) |
114.87 |
113.82 - 136.92 |
0.9185 times |
Thu 31 July 2025 |
112.18 (1.42%) |
110.00 |
107.46 - 119.60 |
0.9837 times |
Mon 30 June 2025 |
110.61 (4.27%) |
105.11 |
102.53 - 116.49 |
0.8893 times |
Fri 30 May 2025 |
106.08 (-2.33%) |
108.82 |
103.57 - 114.32 |
0.7235 times |
Wed 30 April 2025 |
108.61 (-5.38%) |
115.14 |
98.42 - 115.89 |
0.8559 times |
Mon 31 March 2025 |
114.78 (-4.05%) |
119.69 |
111.26 - 129.27 |
0.9166 times |
Fri 28 February 2025 |
119.63 (-8.85%) |
128.60 |
117.90 - 130.29 |
0.8725 times |
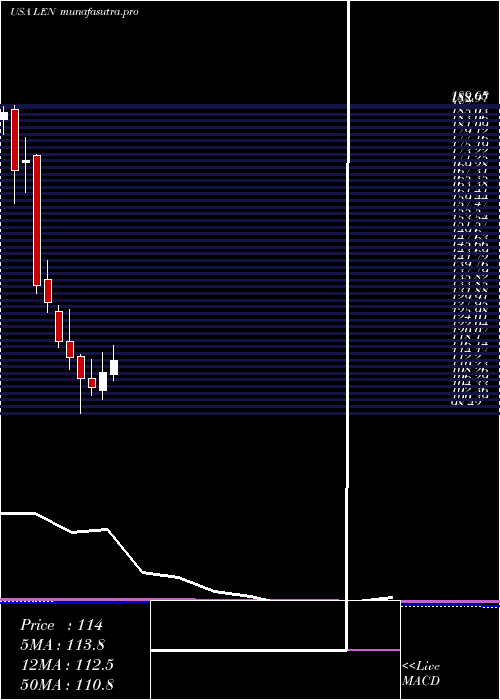
DMA SMA EMA moving averages of Lennar Corporation LEN
DMA (daily moving average) of Lennar Corporation LEN
| DMA period | DMA value | | 5 day DMA | 130.23 | | 12 day DMA | 125.58 | | 20 day DMA | 123.91 | | 35 day DMA | 124.53 | | 50 day DMA | 124.62 | | 100 day DMA | 125.22 | | 150 day DMA | 119.93 | | 200 day DMA | 118.55 | EMA (exponential moving average) of Lennar Corporation LEN
| EMA period | EMA current | EMA prev | EMA prev2 | | 5 day EMA | 129.2 | 130.43 | 129.08 | | 12 day EMA | 127.17 | 127.25 | 126.18 | | 20 day EMA | 125.9 | 125.81 | 125.04 | | 35 day EMA | 125.43 | 125.35 | 124.89 | | 50 day EMA | 125.78 | 125.74 | 125.44 |
SMA (simple moving average) of Lennar Corporation LEN
| SMA period | SMA current | SMA prev | SMA prev2 | | 5 day SMA | 130.23 | 131.13 | 130.72 | | 12 day SMA | 125.58 | 124.53 | 123.53 | | 20 day SMA | 123.91 | 123.63 | 123.06 | | 35 day SMA | 124.53 | 124.41 | 124.1 | | 50 day SMA | 124.62 | 124.63 | 124.63 | | 100 day SMA | 125.22 | 125.12 | 124.94 | | 150 day SMA | 119.93 | 119.8 | 119.64 | | 200 day SMA | 118.55 | 118.53 | 118.47 |
|
|
