LeeEnterprises LEE full analysis,charts,indicators,moving averages,SMA,DMA,EMA,ADX,MACD,RSILee Enterprises LEE WideScreen charts, DMA,SMA,EMA technical analysis, forecast prediction, by indicators ADX,MACD,RSI,CCI USA stock exchange
operates under Consumer Services sector & deals in Newspapers Magazines
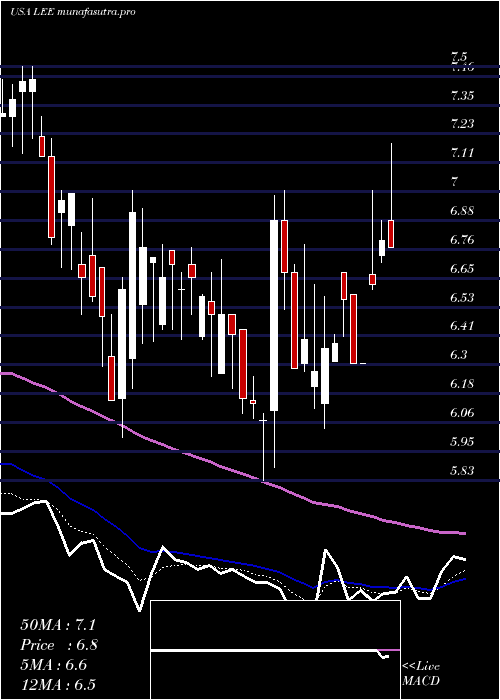
Daily price and charts and targets LeeEnterprises Strong Daily Stock price targets for LeeEnterprises LEE are 4.06 and 4.26 | Daily Target 1 | 3.91 | | Daily Target 2 | 4.01 | | Daily Target 3 | 4.11 | | Daily Target 4 | 4.21 | | Daily Target 5 | 4.31 |
Daily price and volume Lee Enterprises
| Date |
Closing |
Open |
Range |
Volume |
Tue 21 October 2025 |
4.11 (0.98%) |
4.09 |
4.01 - 4.21 |
0.4717 times |
Mon 20 October 2025 |
4.07 (3.04%) |
4.08 |
3.99 - 4.14 |
0.4646 times |
Fri 17 October 2025 |
3.95 (0.25%) |
4.01 |
3.92 - 4.14 |
0.832 times |
Thu 16 October 2025 |
3.94 (-2.96%) |
4.20 |
3.94 - 4.35 |
1.863 times |
Wed 15 October 2025 |
4.06 (-7.52%) |
4.46 |
3.99 - 4.53 |
1.2633 times |
Tue 14 October 2025 |
4.39 (-5.59%) |
4.55 |
3.83 - 4.89 |
1.7042 times |
Mon 13 October 2025 |
4.65 (7.39%) |
4.52 |
4.27 - 4.74 |
0.5546 times |
Fri 10 October 2025 |
4.33 (-7.87%) |
4.61 |
4.27 - 4.99 |
0.8722 times |
Thu 09 October 2025 |
4.70 (-7.84%) |
5.14 |
4.65 - 5.43 |
1.1519 times |
Wed 08 October 2025 |
5.10 (0.39%) |
5.10 |
5.01 - 5.37 |
0.8225 times |
Tue 07 October 2025 |
5.08 (-4.33%) |
5.31 |
5.00 - 5.31 |
1.2847 times |
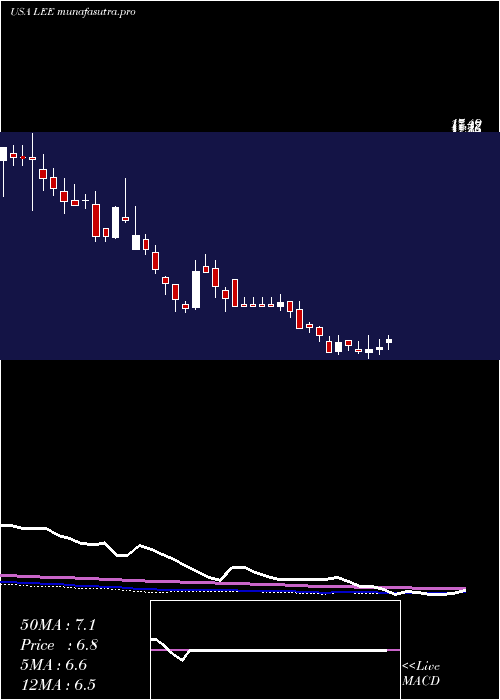
Weekly price and charts LeeEnterprises Strong weekly Stock price targets for LeeEnterprises LEE are 4.05 and 4.27 | Weekly Target 1 | 3.88 | | Weekly Target 2 | 4 | | Weekly Target 3 | 4.1033333333333 | | Weekly Target 4 | 4.22 | | Weekly Target 5 | 4.32 |
Weekly price and volumes for Lee Enterprises
| Date |
Closing |
Open |
Range |
Volume |
Tue 21 October 2025 |
4.11 (4.05%) |
4.08 |
3.99 - 4.21 |
0.2323 times |
Fri 17 October 2025 |
3.95 (-8.78%) |
4.52 |
3.83 - 4.89 |
1.5427 times |
Fri 10 October 2025 |
4.33 (-18.61%) |
5.42 |
4.27 - 5.43 |
1.0716 times |
Fri 03 October 2025 |
5.32 (-6.01%) |
5.31 |
5.30 - 5.70 |
0.4433 times |
Fri 26 September 2025 |
5.66 (4.81%) |
5.44 |
5.22 - 6.00 |
0.8646 times |
Fri 19 September 2025 |
5.40 (26.76%) |
4.29 |
4.26 - 6.95 |
4.4381 times |
Fri 12 September 2025 |
4.26 (4.16%) |
4.07 |
3.91 - 4.44 |
0.4023 times |
Fri 05 September 2025 |
4.09 (-5.76%) |
4.25 |
3.82 - 4.44 |
0.464 times |
Fri 29 August 2025 |
4.34 (0%) |
4.31 |
4.22 - 4.43 |
0.0735 times |
Fri 29 August 2025 |
4.34 (6.37%) |
4.10 |
4.10 - 4.50 |
0.4676 times |
Fri 22 August 2025 |
4.08 (-6.64%) |
4.35 |
3.96 - 4.64 |
0.9181 times |
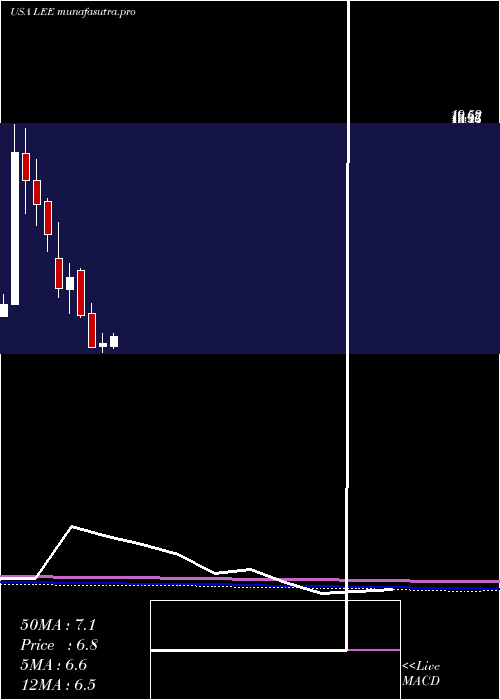
Monthly price and charts LeeEnterprises Strong monthly Stock price targets for LeeEnterprises LEE are 3.06 and 4.89 | Monthly Target 1 | 2.7 | | Monthly Target 2 | 3.41 | | Monthly Target 3 | 4.5333333333333 | | Monthly Target 4 | 5.24 | | Monthly Target 5 | 6.36 |
Monthly price and volumes Lee Enterprises
| Date |
Closing |
Open |
Range |
Volume |
Tue 21 October 2025 |
4.11 (-24.45%) |
5.44 |
3.83 - 5.66 |
0.9541 times |
Tue 30 September 2025 |
5.44 (25.35%) |
4.25 |
3.82 - 6.95 |
1.9127 times |
Fri 29 August 2025 |
4.34 (-12.5%) |
4.92 |
3.79 - 5.07 |
1.1419 times |
Thu 31 July 2025 |
4.96 (-22.5%) |
6.21 |
4.88 - 7.76 |
0.8106 times |
Mon 30 June 2025 |
6.40 (4.07%) |
6.16 |
5.83 - 7.00 |
1.2549 times |
Fri 30 May 2025 |
6.15 (-23.6%) |
8.17 |
6.15 - 8.80 |
0.5458 times |
Wed 30 April 2025 |
8.05 (-22.45%) |
10.77 |
7.97 - 10.88 |
0.5966 times |
Mon 31 March 2025 |
10.38 (7.01%) |
9.65 |
8.19 - 11.21 |
0.6508 times |
Fri 28 February 2025 |
9.70 (-25.33%) |
11.50 |
9.15 - 13.69 |
0.6394 times |
Fri 31 January 2025 |
12.99 (-12.11%) |
14.97 |
11.91 - 15.15 |
1.4931 times |
Tue 31 December 2024 |
14.78 (-9.05%) |
16.24 |
13.51 - 17.49 |
0.8812 times |
DMA SMA EMA moving averages of Lee Enterprises LEE
DMA (daily moving average) of Lee Enterprises LEE
| DMA period | DMA value | | 5 day DMA | 4.03 | | 12 day DMA | 4.47 | | 20 day DMA | 4.87 | | 35 day DMA | 4.82 | | 50 day DMA | 4.65 | | 100 day DMA | 5.37 | | 150 day DMA | 6.41 | | 200 day DMA | 7.67 | EMA (exponential moving average) of Lee Enterprises LEE
| EMA period | EMA current | EMA prev | EMA prev2 | | 5 day EMA | 4.12 | 4.13 | 4.16 | | 12 day EMA | 4.41 | 4.46 | 4.53 | | 20 day EMA | 4.59 | 4.64 | 4.7 | | 35 day EMA | 4.63 | 4.66 | 4.69 | | 50 day EMA | 4.57 | 4.59 | 4.61 |
SMA (simple moving average) of Lee Enterprises LEE
| SMA period | SMA current | SMA prev | SMA prev2 | | 5 day SMA | 4.03 | 4.08 | 4.2 | | 12 day SMA | 4.47 | 4.58 | 4.68 | | 20 day SMA | 4.87 | 4.95 | 5.03 | | 35 day SMA | 4.82 | 4.82 | 4.83 | | 50 day SMA | 4.65 | 4.65 | 4.65 | | 100 day SMA | 5.37 | 5.39 | 5.42 | | 150 day SMA | 6.41 | 6.44 | 6.46 | | 200 day SMA | 7.67 | 7.72 | 7.77 |
|
|
