SemiledsCorporation LEDS full analysis,charts,indicators,moving averages,SMA,DMA,EMA,ADX,MACD,RSISemileds Corporation LEDS WideScreen charts, DMA,SMA,EMA technical analysis, forecast prediction, by indicators ADX,MACD,RSI,CCI USA stock exchange
operates under Technology sector & deals in Semiconductors
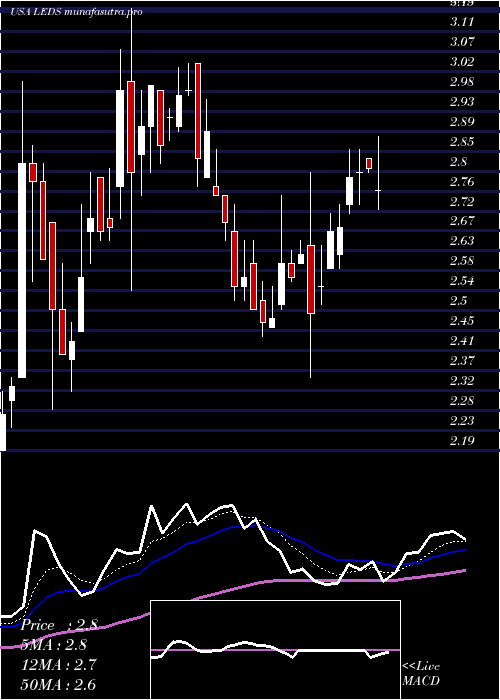
Daily price and charts and targets SemiledsCorporation Strong Daily Stock price targets for SemiledsCorporation LEDS are 2.35 and 2.59 | Daily Target 1 | 2.15 | | Daily Target 2 | 2.3 | | Daily Target 3 | 2.3933333333333 | | Daily Target 4 | 2.54 | | Daily Target 5 | 2.63 |
Daily price and volume Semileds Corporation
| Date |
Closing |
Open |
Range |
Volume |
Mon 20 October 2025 |
2.44 (6.55%) |
2.27 |
2.25 - 2.49 |
0.4748 times |
Fri 17 October 2025 |
2.29 (-5.76%) |
2.38 |
2.26 - 2.42 |
0.6162 times |
Thu 16 October 2025 |
2.43 (0%) |
2.54 |
2.39 - 2.54 |
0.8115 times |
Wed 15 October 2025 |
2.43 (4.29%) |
2.53 |
2.33 - 2.53 |
0.972 times |
Tue 14 October 2025 |
2.33 (5.43%) |
2.20 |
2.20 - 2.35 |
0.6856 times |
Mon 13 October 2025 |
2.21 (0.45%) |
2.15 |
2.02 - 2.27 |
1.7098 times |
Fri 10 October 2025 |
2.20 (-9.47%) |
2.45 |
2.20 - 2.45 |
0.946 times |
Thu 09 October 2025 |
2.43 (-4.33%) |
2.59 |
2.43 - 2.59 |
0.9373 times |
Wed 08 October 2025 |
2.54 (0.79%) |
2.55 |
2.43 - 2.67 |
1.5492 times |
Tue 07 October 2025 |
2.52 (0.4%) |
2.62 |
2.46 - 2.63 |
1.2975 times |
Mon 06 October 2025 |
2.51 (4.15%) |
2.40 |
2.20 - 2.65 |
4.9854 times |
Weekly price and charts SemiledsCorporation Strong weekly Stock price targets for SemiledsCorporation LEDS are 2.35 and 2.59 | Weekly Target 1 | 2.15 | | Weekly Target 2 | 2.3 | | Weekly Target 3 | 2.3933333333333 | | Weekly Target 4 | 2.54 | | Weekly Target 5 | 2.63 |
Weekly price and volumes for Semileds Corporation
| Date |
Closing |
Open |
Range |
Volume |
Mon 20 October 2025 |
2.44 (6.55%) |
2.27 |
2.25 - 2.49 |
0.0548 times |
Fri 17 October 2025 |
2.29 (4.09%) |
2.15 |
2.02 - 2.54 |
0.5538 times |
Fri 10 October 2025 |
2.20 (-8.71%) |
2.40 |
2.20 - 2.67 |
1.1221 times |
Fri 03 October 2025 |
2.41 (10.55%) |
2.15 |
2.10 - 2.58 |
0.9189 times |
Fri 26 September 2025 |
2.18 (2.83%) |
2.12 |
2.02 - 2.36 |
0.405 times |
Fri 19 September 2025 |
2.12 (10.99%) |
1.86 |
1.86 - 2.26 |
1.0415 times |
Fri 12 September 2025 |
1.91 (12.35%) |
1.75 |
1.70 - 2.74 |
5.287 times |
Fri 05 September 2025 |
1.70 (-9.09%) |
1.74 |
1.61 - 1.86 |
0.3393 times |
Fri 29 August 2025 |
1.87 (0%) |
1.87 |
1.86 - 1.88 |
0.009 times |
Fri 29 August 2025 |
1.87 (-2.09%) |
1.91 |
1.83 - 2.04 |
0.2686 times |
Fri 22 August 2025 |
1.91 (4.95%) |
1.86 |
1.63 - 2.02 |
0.7357 times |
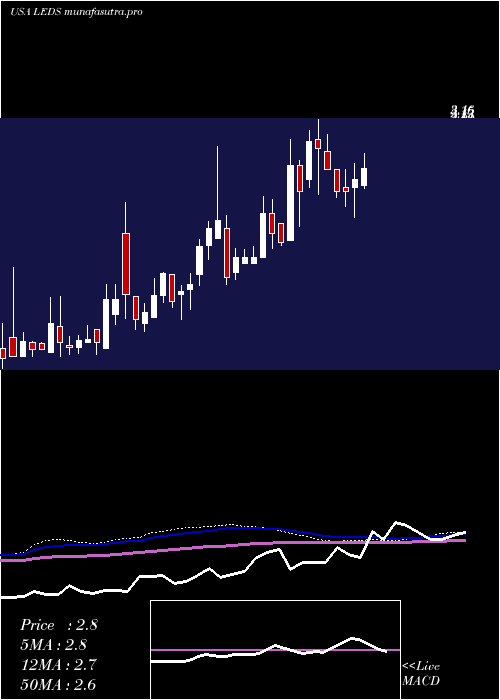
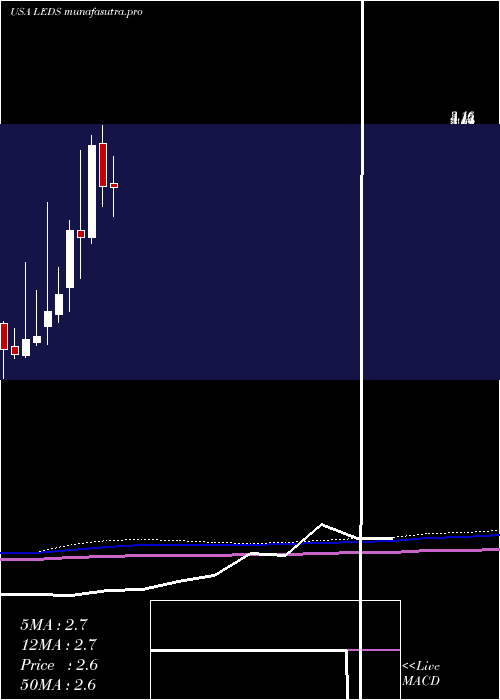
Monthly price and charts SemiledsCorporation Strong monthly Stock price targets for SemiledsCorporation LEDS are 2.23 and 2.88 | Monthly Target 1 | 1.73 | | Monthly Target 2 | 2.08 | | Monthly Target 3 | 2.3766666666667 | | Monthly Target 4 | 2.73 | | Monthly Target 5 | 3.03 |
Monthly price and volumes Semileds Corporation
| Date |
Closing |
Open |
Range |
Volume |
Mon 20 October 2025 |
2.44 (11.42%) |
2.17 |
2.02 - 2.67 |
0.2348 times |
Tue 30 September 2025 |
2.19 (17.11%) |
1.74 |
1.61 - 2.74 |
0.6953 times |
Fri 29 August 2025 |
1.87 (3.31%) |
1.76 |
1.41 - 2.04 |
0.232 times |
Thu 31 July 2025 |
1.81 (-30.92%) |
2.64 |
1.68 - 2.88 |
0.4809 times |
Mon 30 June 2025 |
2.62 (-12.08%) |
3.00 |
2.44 - 3.16 |
0.3073 times |
Fri 30 May 2025 |
2.98 (37.33%) |
2.17 |
2.11 - 3.07 |
0.7582 times |
Wed 30 April 2025 |
2.17 (-2.69%) |
2.23 |
1.80 - 2.94 |
0.3599 times |
Mon 31 March 2025 |
2.23 (34.34%) |
1.72 |
1.51 - 2.32 |
0.2437 times |
Fri 28 February 2025 |
1.66 (9.93%) |
1.48 |
1.41 - 1.90 |
0.2201 times |
Fri 31 January 2025 |
1.51 (17.05%) |
1.38 |
1.22 - 2.48 |
6.4678 times |
Tue 31 December 2024 |
1.29 (2.38%) |
1.24 |
1.21 - 1.70 |
0.7104 times |
DMA SMA EMA moving averages of Semileds Corporation LEDS
DMA (daily moving average) of Semileds Corporation LEDS
| DMA period | DMA value | | 5 day DMA | 2.38 | | 12 day DMA | 2.4 | | 20 day DMA | 2.32 | | 35 day DMA | 2.15 | | 50 day DMA | 2.05 | | 100 day DMA | 2.24 | | 150 day DMA | 2.23 | | 200 day DMA | 2.07 | EMA (exponential moving average) of Semileds Corporation LEDS
| EMA period | EMA current | EMA prev | EMA prev2 | | 5 day EMA | 2.38 | 2.35 | 2.38 | | 12 day EMA | 2.36 | 2.34 | 2.35 | | 20 day EMA | 2.3 | 2.29 | 2.29 | | 35 day EMA | 2.2 | 2.19 | 2.18 | | 50 day EMA | 2.05 | 2.03 | 2.02 |
SMA (simple moving average) of Semileds Corporation LEDS
| SMA period | SMA current | SMA prev | SMA prev2 | | 5 day SMA | 2.38 | 2.34 | 2.32 | | 12 day SMA | 2.4 | 2.39 | 2.38 | | 20 day SMA | 2.32 | 2.3 | 2.29 | | 35 day SMA | 2.15 | 2.13 | 2.12 | | 50 day SMA | 2.05 | 2.04 | 2.03 | | 100 day SMA | 2.24 | 2.24 | 2.24 | | 150 day SMA | 2.23 | 2.23 | 2.22 | | 200 day SMA | 2.07 | 2.07 | 2.06 |
|
|
