LearCorporation LEA full analysis,charts,indicators,moving averages,SMA,DMA,EMA,ADX,MACD,RSILear Corporation LEA WideScreen charts, DMA,SMA,EMA technical analysis, forecast prediction, by indicators ADX,MACD,RSI,CCI USA stock exchange
operates under Capital Goods sector & deals in Auto Parts O E M
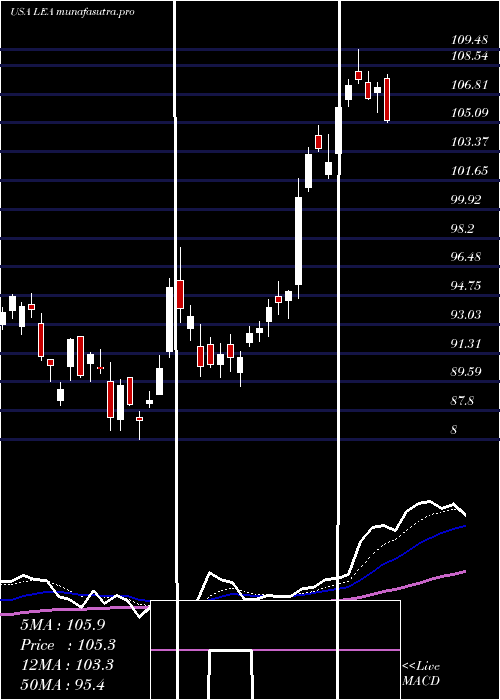
Daily price and charts and targets LearCorporation Strong Daily Stock price targets for LearCorporation LEA are 107.66 and 109.47 | Daily Target 1 | 107.23 | | Daily Target 2 | 108.09 | | Daily Target 3 | 109.04333333333 | | Daily Target 4 | 109.9 | | Daily Target 5 | 110.85 |
Daily price and volume Lear Corporation
| Date |
Closing |
Open |
Range |
Volume |
Thu 04 December 2025 |
108.94 (-0.32%) |
109.41 |
108.19 - 110.00 |
1.2746 times |
Wed 03 December 2025 |
109.29 (1.33%) |
108.00 |
107.97 - 109.90 |
1.1551 times |
Tue 02 December 2025 |
107.86 (-0.33%) |
108.25 |
106.15 - 109.04 |
1.6113 times |
Mon 01 December 2025 |
108.22 (0.8%) |
107.15 |
106.79 - 109.77 |
1.1372 times |
Fri 28 November 2025 |
107.36 (-0.38%) |
107.98 |
107.04 - 108.77 |
1.099 times |
Wed 26 November 2025 |
107.77 (-0.53%) |
107.43 |
107.02 - 109.80 |
0.8095 times |
Tue 25 November 2025 |
108.34 (3.3%) |
105.86 |
105.45 - 109.06 |
0.6129 times |
Mon 24 November 2025 |
104.88 (0.7%) |
104.29 |
103.50 - 105.64 |
0.7808 times |
Fri 21 November 2025 |
104.15 (4.91%) |
100.21 |
100.21 - 104.63 |
0.8621 times |
Thu 20 November 2025 |
99.28 (-3.34%) |
103.14 |
99.00 - 104.69 |
0.6575 times |
Wed 19 November 2025 |
102.71 (0.13%) |
102.82 |
101.98 - 103.74 |
0.5262 times |
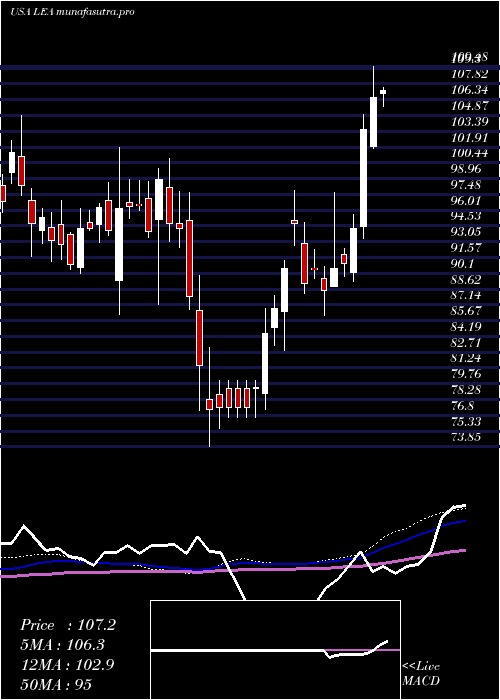
Weekly price and charts LearCorporation Strong weekly Stock price targets for LearCorporation LEA are 107.55 and 111.4 | Weekly Target 1 | 104.51 | | Weekly Target 2 | 106.73 | | Weekly Target 3 | 108.36333333333 | | Weekly Target 4 | 110.58 | | Weekly Target 5 | 112.21 |
Weekly price and volumes for Lear Corporation
| Date |
Closing |
Open |
Range |
Volume |
Thu 04 December 2025 |
108.94 (1.47%) |
107.15 |
106.15 - 110.00 |
1.339 times |
Fri 28 November 2025 |
107.36 (3.08%) |
104.29 |
103.50 - 109.80 |
0.8539 times |
Fri 21 November 2025 |
104.15 (-1.77%) |
105.36 |
99.00 - 105.36 |
1.0687 times |
Fri 14 November 2025 |
106.03 (-3.72%) |
110.59 |
105.37 - 110.66 |
1.1214 times |
Fri 07 November 2025 |
110.13 (5.24%) |
106.97 |
105.38 - 110.94 |
1.0772 times |
Fri 31 October 2025 |
104.65 (0%) |
106.05 |
99.12 - 110.88 |
0.3974 times |
Fri 31 October 2025 |
104.65 (2.69%) |
102.26 |
99.12 - 110.88 |
1.4375 times |
Fri 24 October 2025 |
101.91 (2.46%) |
100.06 |
99.01 - 102.44 |
0.8004 times |
Fri 17 October 2025 |
99.46 (2.77%) |
97.73 |
96.04 - 101.46 |
1.0117 times |
Fri 10 October 2025 |
96.78 (-6.93%) |
104.25 |
96.44 - 104.63 |
0.8927 times |
Fri 03 October 2025 |
103.99 (2.51%) |
102.00 |
99.14 - 104.00 |
1.1682 times |
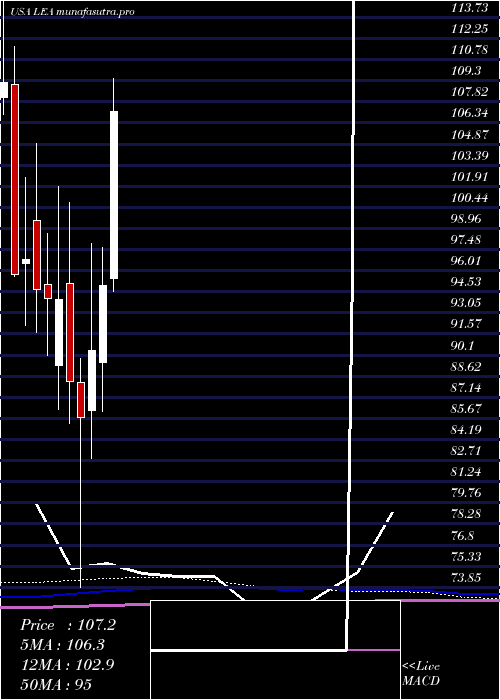
Monthly price and charts LearCorporation Strong monthly Stock price targets for LearCorporation LEA are 107.55 and 111.4 | Monthly Target 1 | 104.51 | | Monthly Target 2 | 106.73 | | Monthly Target 3 | 108.36333333333 | | Monthly Target 4 | 110.58 | | Monthly Target 5 | 112.21 |
Monthly price and volumes Lear Corporation
| Date |
Closing |
Open |
Range |
Volume |
Thu 04 December 2025 |
108.94 (1.47%) |
107.15 |
106.15 - 110.00 |
0.278 times |
Fri 28 November 2025 |
107.36 (2.59%) |
106.97 |
99.00 - 110.94 |
0.8555 times |
Fri 31 October 2025 |
104.65 (4.02%) |
100.31 |
96.04 - 110.88 |
1.0812 times |
Tue 30 September 2025 |
100.61 (-8.54%) |
108.60 |
98.85 - 113.10 |
1.2577 times |
Fri 29 August 2025 |
110.00 (16.66%) |
93.45 |
91.67 - 111.00 |
0.7872 times |
Thu 31 July 2025 |
94.29 (-0.73%) |
95.45 |
93.35 - 109.48 |
1.2619 times |
Mon 30 June 2025 |
94.98 (5.04%) |
89.60 |
86.14 - 97.62 |
1.0754 times |
Fri 30 May 2025 |
90.42 (5.45%) |
86.21 |
82.88 - 97.88 |
1.0221 times |
Wed 30 April 2025 |
85.75 (-2.8%) |
88.19 |
73.85 - 89.88 |
1.0587 times |
Mon 31 March 2025 |
88.22 (-6.14%) |
95.10 |
85.29 - 100.79 |
1.3223 times |
Fri 28 February 2025 |
93.99 (-0.11%) |
89.39 |
86.28 - 101.90 |
1.0666 times |
DMA SMA EMA moving averages of Lear Corporation LEA
DMA (daily moving average) of Lear Corporation LEA
| DMA period | DMA value | | 5 day DMA | 108.33 | | 12 day DMA | 105.95 | | 20 day DMA | 106.63 | | 35 day DMA | 104.94 | | 50 day DMA | 103.6 | | 100 day DMA | 103.91 | | 150 day DMA | 100.57 | | 200 day DMA | 97.49 | EMA (exponential moving average) of Lear Corporation LEA
| EMA period | EMA current | EMA prev | EMA prev2 | | 5 day EMA | 108.3 | 107.98 | 107.33 | | 12 day EMA | 107.13 | 106.8 | 106.35 | | 20 day EMA | 106.4 | 106.13 | 105.8 | | 35 day EMA | 105.19 | 104.97 | 104.72 | | 50 day EMA | 104.12 | 103.92 | 103.7 |
SMA (simple moving average) of Lear Corporation LEA
| SMA period | SMA current | SMA prev | SMA prev2 | | 5 day SMA | 108.33 | 108.1 | 107.91 | | 12 day SMA | 105.95 | 105.36 | 105.09 | | 20 day SMA | 106.63 | 106.64 | 106.51 | | 35 day SMA | 104.94 | 104.69 | 104.42 | | 50 day SMA | 103.6 | 103.45 | 103.33 | | 100 day SMA | 103.91 | 103.87 | 103.85 | | 150 day SMA | 100.57 | 100.42 | 100.27 | | 200 day SMA | 97.49 | 97.43 | 97.38 |
|
|
