LandsEnd LE full analysis,charts,indicators,moving averages,SMA,DMA,EMA,ADX,MACD,RSILands End LE WideScreen charts, DMA,SMA,EMA technical analysis, forecast prediction, by indicators ADX,MACD,RSI,CCI USA stock exchange
operates under Consumer Services sector & deals in Clothing Shoe Accessory Stores
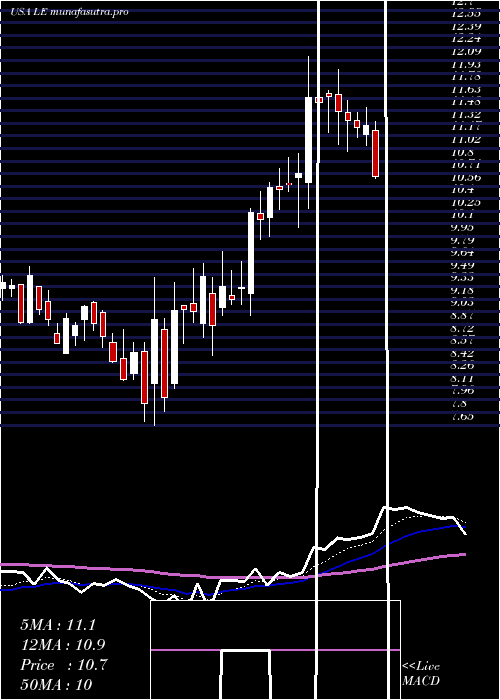
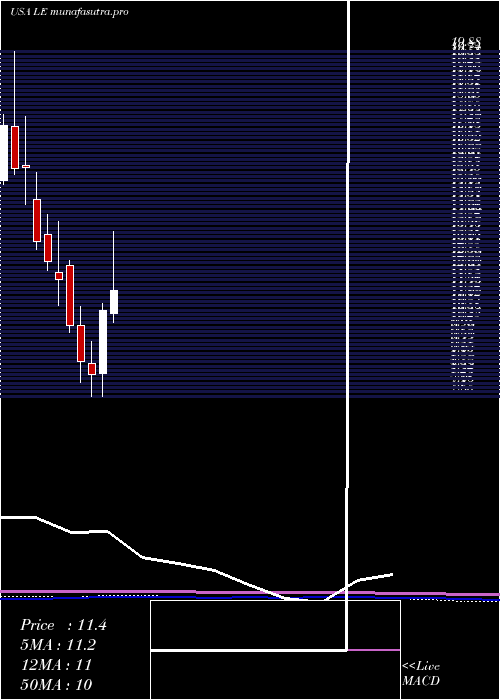
Daily price and charts and targets LandsEnd Strong Daily Stock price targets for LandsEnd LE are 15.98 and 16.65 | Daily Target 1 | 15.78 | | Daily Target 2 | 16.17 | | Daily Target 3 | 16.446666666667 | | Daily Target 4 | 16.84 | | Daily Target 5 | 17.12 |
Daily price and volume Lands End
| Date |
Closing |
Open |
Range |
Volume |
Thu 04 December 2025 |
16.57 (-0.72%) |
16.67 |
16.05 - 16.72 |
0.9183 times |
Wed 03 December 2025 |
16.69 (6.31%) |
15.80 |
15.35 - 16.80 |
0.9713 times |
Tue 02 December 2025 |
15.70 (-4.73%) |
16.48 |
15.66 - 16.55 |
1.2837 times |
Mon 01 December 2025 |
16.48 (4.37%) |
15.46 |
15.19 - 16.68 |
1.0087 times |
Fri 28 November 2025 |
15.79 (-1%) |
15.95 |
15.59 - 15.95 |
0.3357 times |
Wed 26 November 2025 |
15.95 (1.79%) |
15.62 |
15.56 - 16.05 |
0.9052 times |
Tue 25 November 2025 |
15.67 (2.69%) |
15.27 |
15.20 - 15.94 |
1.3813 times |
Mon 24 November 2025 |
15.26 (4.66%) |
14.53 |
14.15 - 15.53 |
0.9528 times |
Fri 21 November 2025 |
14.58 (5.88%) |
13.86 |
13.86 - 14.92 |
0.9326 times |
Thu 20 November 2025 |
13.77 (-4.57%) |
14.73 |
13.63 - 15.12 |
1.3105 times |
Wed 19 November 2025 |
14.43 (-5.31%) |
15.32 |
14.33 - 15.56 |
0.8713 times |
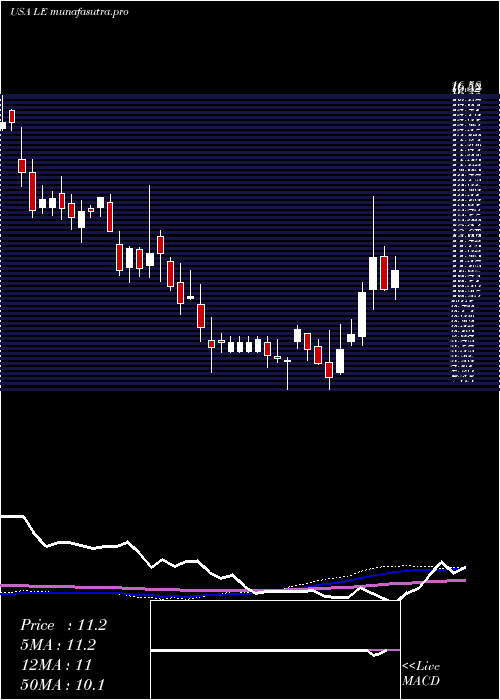
Weekly price and charts LandsEnd Strong weekly Stock price targets for LandsEnd LE are 15.88 and 17.49 | Weekly Target 1 | 14.58 | | Weekly Target 2 | 15.57 | | Weekly Target 3 | 16.186666666667 | | Weekly Target 4 | 17.18 | | Weekly Target 5 | 17.8 |
Weekly price and volumes for Lands End
| Date |
Closing |
Open |
Range |
Volume |
Thu 04 December 2025 |
16.57 (4.94%) |
15.46 |
15.19 - 16.80 |
1.075 times |
Fri 28 November 2025 |
15.79 (8.3%) |
14.53 |
14.15 - 16.05 |
0.9189 times |
Fri 21 November 2025 |
14.58 (-11.21%) |
16.21 |
13.63 - 16.36 |
1.3519 times |
Fri 14 November 2025 |
16.42 (1.8%) |
16.33 |
15.76 - 16.86 |
1.1299 times |
Fri 07 November 2025 |
16.13 (2.48%) |
15.04 |
14.55 - 16.46 |
0.9506 times |
Fri 31 October 2025 |
15.74 (0%) |
16.21 |
15.71 - 16.22 |
0.1615 times |
Fri 31 October 2025 |
15.74 (-1.32%) |
16.22 |
15.68 - 16.87 |
1.1473 times |
Fri 24 October 2025 |
15.95 (4.59%) |
15.45 |
15.22 - 16.35 |
0.8871 times |
Fri 17 October 2025 |
15.25 (8.7%) |
14.24 |
14.21 - 15.86 |
1.0355 times |
Fri 10 October 2025 |
14.03 (-7.7%) |
15.10 |
13.94 - 15.75 |
1.3422 times |
Fri 03 October 2025 |
15.20 (1.67%) |
15.03 |
13.78 - 15.43 |
1.7089 times |
Monthly price and charts LandsEnd Strong monthly Stock price targets for LandsEnd LE are 15.88 and 17.49 | Monthly Target 1 | 14.58 | | Monthly Target 2 | 15.57 | | Monthly Target 3 | 16.186666666667 | | Monthly Target 4 | 17.18 | | Monthly Target 5 | 17.8 |
Monthly price and volumes Lands End
| Date |
Closing |
Open |
Range |
Volume |
Thu 04 December 2025 |
16.57 (4.94%) |
15.46 |
15.19 - 16.80 |
0.13 times |
Fri 28 November 2025 |
15.79 (0.32%) |
15.04 |
13.63 - 16.86 |
0.5262 times |
Fri 31 October 2025 |
15.74 (11.63%) |
14.09 |
13.94 - 16.87 |
0.6603 times |
Tue 30 September 2025 |
14.10 (-1.81%) |
14.07 |
13.25 - 16.49 |
1.3874 times |
Fri 29 August 2025 |
14.36 (22.42%) |
11.50 |
11.16 - 14.87 |
1.4601 times |
Thu 31 July 2025 |
11.73 (9.52%) |
10.60 |
10.28 - 13.60 |
1.6404 times |
Mon 30 June 2025 |
10.71 (27.2%) |
8.46 |
7.65 - 10.95 |
2.3305 times |
Fri 30 May 2025 |
8.42 (-5.18%) |
8.83 |
7.65 - 9.58 |
0.8204 times |
Wed 30 April 2025 |
8.88 (-12.77%) |
10.18 |
8.15 - 10.83 |
0.5733 times |
Mon 31 March 2025 |
10.18 (-13.58%) |
12.29 |
9.91 - 12.48 |
0.4714 times |
Fri 28 February 2025 |
11.78 (-5.38%) |
12.05 |
10.88 - 13.85 |
0.4226 times |
DMA SMA EMA moving averages of Lands End LE
DMA (daily moving average) of Lands End LE
| DMA period | DMA value | | 5 day DMA | 16.25 | | 12 day DMA | 15.51 | | 20 day DMA | 15.78 | | 35 day DMA | 15.8 | | 50 day DMA | 15.54 | | 100 day DMA | 14.6 | | 150 day DMA | 12.9 | | 200 day DMA | 12.22 | EMA (exponential moving average) of Lands End LE
| EMA period | EMA current | EMA prev | EMA prev2 | | 5 day EMA | 16.26 | 16.1 | 15.8 | | 12 day EMA | 15.93 | 15.81 | 15.65 | | 20 day EMA | 15.8 | 15.72 | 15.62 | | 35 day EMA | 15.67 | 15.62 | 15.56 | | 50 day EMA | 15.61 | 15.57 | 15.52 |
SMA (simple moving average) of Lands End LE
| SMA period | SMA current | SMA prev | SMA prev2 | | 5 day SMA | 16.25 | 16.12 | 15.92 | | 12 day SMA | 15.51 | 15.4 | 15.38 | | 20 day SMA | 15.78 | 15.76 | 15.66 | | 35 day SMA | 15.8 | 15.77 | 15.74 | | 50 day SMA | 15.54 | 15.51 | 15.49 | | 100 day SMA | 14.6 | 14.55 | 14.49 | | 150 day SMA | 12.9 | 12.85 | 12.79 | | 200 day SMA | 12.22 | 12.2 | 12.17 |
|
|
