LibertyGlobal LBTYA full analysis,charts,indicators,moving averages,SMA,DMA,EMA,ADX,MACD,RSILiberty Global LBTYA WideScreen charts, DMA,SMA,EMA technical analysis, forecast prediction, by indicators ADX,MACD,RSI,CCI USA stock exchange
operates under Consumer Services sector & deals in Television Services
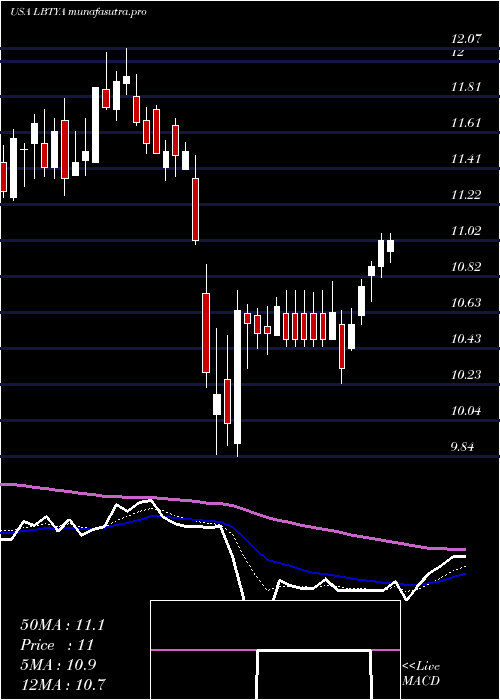
Daily price and charts and targets LibertyGlobal Strong Daily Stock price targets for LibertyGlobal LBTYA are 10.88 and 11.26 | Daily Target 1 | 10.81 | | Daily Target 2 | 10.95 | | Daily Target 3 | 11.186666666667 | | Daily Target 4 | 11.33 | | Daily Target 5 | 11.57 |
Daily price and volume Liberty Global
| Date |
Closing |
Open |
Range |
Volume |
Tue 21 October 2025 |
11.10 (-0.98%) |
11.20 |
11.04 - 11.42 |
1.025 times |
Mon 20 October 2025 |
11.21 (1.91%) |
11.09 |
10.99 - 11.30 |
1.2272 times |
Fri 17 October 2025 |
11.00 (1.85%) |
10.79 |
10.78 - 11.06 |
0.8809 times |
Thu 16 October 2025 |
10.80 (-2.44%) |
11.07 |
10.78 - 11.22 |
1.4049 times |
Wed 15 October 2025 |
11.07 (1.1%) |
10.99 |
10.97 - 11.13 |
0.5727 times |
Tue 14 October 2025 |
10.95 (0.09%) |
10.82 |
10.81 - 11.07 |
0.8623 times |
Mon 13 October 2025 |
10.94 (3.6%) |
10.80 |
10.72 - 10.98 |
1.1351 times |
Fri 10 October 2025 |
10.56 (-2.49%) |
10.85 |
10.37 - 10.98 |
1.2834 times |
Thu 09 October 2025 |
10.83 (-3.9%) |
11.30 |
10.83 - 11.39 |
0.8679 times |
Wed 08 October 2025 |
11.27 (-0.97%) |
11.45 |
11.22 - 11.55 |
0.7405 times |
Tue 07 October 2025 |
11.38 (-0.44%) |
11.39 |
11.30 - 11.55 |
0.8705 times |
Weekly price and charts LibertyGlobal Strong weekly Stock price targets for LibertyGlobal LBTYA are 11.05 and 11.48 | Weekly Target 1 | 10.74 | | Weekly Target 2 | 10.92 | | Weekly Target 3 | 11.17 | | Weekly Target 4 | 11.35 | | Weekly Target 5 | 11.6 |
Weekly price and volumes for Liberty Global
| Date |
Closing |
Open |
Range |
Volume |
Tue 21 October 2025 |
11.10 (0.91%) |
11.09 |
10.99 - 11.42 |
0.5883 times |
Fri 17 October 2025 |
11.00 (4.17%) |
10.80 |
10.72 - 11.22 |
1.2684 times |
Fri 10 October 2025 |
10.56 (-10.2%) |
11.75 |
10.37 - 11.84 |
1.2348 times |
Fri 03 October 2025 |
11.76 (1.64%) |
11.64 |
11.37 - 11.97 |
1.1894 times |
Fri 26 September 2025 |
11.57 (-1.62%) |
11.74 |
11.26 - 11.89 |
1.1467 times |
Fri 19 September 2025 |
11.76 (-1.18%) |
11.92 |
11.73 - 12.01 |
1.0601 times |
Fri 12 September 2025 |
11.90 (0.17%) |
11.91 |
11.25 - 12.01 |
1.324 times |
Fri 05 September 2025 |
11.88 (1.19%) |
11.53 |
11.50 - 12.09 |
1.0968 times |
Fri 29 August 2025 |
11.74 (0%) |
11.69 |
11.59 - 11.82 |
0.1844 times |
Fri 29 August 2025 |
11.74 (0.51%) |
11.69 |
11.54 - 11.86 |
0.9071 times |
Fri 22 August 2025 |
11.68 (1.3%) |
11.58 |
11.15 - 11.75 |
1.2754 times |
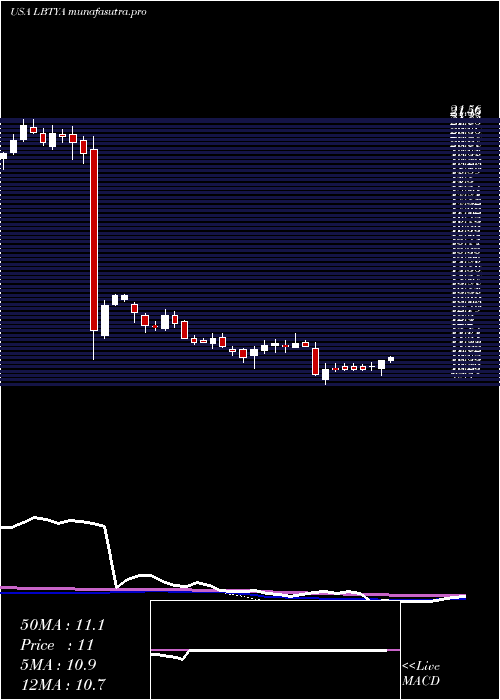
Monthly price and charts LibertyGlobal Strong monthly Stock price targets for LibertyGlobal LBTYA are 9.94 and 11.54 | Monthly Target 1 | 9.55 | | Monthly Target 2 | 10.32 | | Monthly Target 3 | 11.146666666667 | | Monthly Target 4 | 11.92 | | Monthly Target 5 | 12.75 |
Monthly price and volumes Liberty Global
| Date |
Closing |
Open |
Range |
Volume |
Tue 21 October 2025 |
11.10 (-3.14%) |
11.48 |
10.37 - 11.97 |
0.6766 times |
Tue 30 September 2025 |
11.46 (-2.39%) |
11.53 |
11.25 - 12.09 |
0.9452 times |
Fri 29 August 2025 |
11.74 (17.17%) |
10.44 |
9.92 - 11.86 |
1.031 times |
Thu 31 July 2025 |
10.02 (0.1%) |
10.00 |
9.62 - 10.38 |
0.9168 times |
Mon 30 June 2025 |
10.01 (3.95%) |
9.61 |
9.45 - 10.11 |
0.8936 times |
Fri 30 May 2025 |
9.63 (-12.05%) |
10.89 |
9.03 - 10.92 |
1.6437 times |
Wed 30 April 2025 |
10.95 (-4.87%) |
11.65 |
9.84 - 11.69 |
0.8299 times |
Mon 31 March 2025 |
11.51 (-0.43%) |
11.56 |
11.24 - 12.07 |
0.9457 times |
Fri 28 February 2025 |
11.56 (0.43%) |
11.37 |
10.55 - 11.79 |
1.2536 times |
Fri 31 January 2025 |
11.51 (-9.8%) |
12.80 |
11.42 - 13.17 |
0.8639 times |
Tue 31 December 2024 |
12.76 (-7.27%) |
13.36 |
12.12 - 13.46 |
0.8933 times |

DMA SMA EMA moving averages of Liberty Global LBTYA
DMA (daily moving average) of Liberty Global LBTYA
| DMA period | DMA value | | 5 day DMA | 11.04 | | 12 day DMA | 11.05 | | 20 day DMA | 11.26 | | 35 day DMA | 11.48 | | 50 day DMA | 11.51 | | 100 day DMA | 10.78 | | 150 day DMA | 10.66 | | 200 day DMA | 10.89 | EMA (exponential moving average) of Liberty Global LBTYA
| EMA period | EMA current | EMA prev | EMA prev2 | | 5 day EMA | 11.06 | 11.04 | 10.96 | | 12 day EMA | 11.11 | 11.11 | 11.09 | | 20 day EMA | 11.22 | 11.23 | 11.23 | | 35 day EMA | 11.3 | 11.31 | 11.32 | | 50 day EMA | 11.42 | 11.43 | 11.44 |
SMA (simple moving average) of Liberty Global LBTYA
| SMA period | SMA current | SMA prev | SMA prev2 | | 5 day SMA | 11.04 | 11.01 | 10.95 | | 12 day SMA | 11.05 | 11.1 | 11.14 | | 20 day SMA | 11.26 | 11.28 | 11.3 | | 35 day SMA | 11.48 | 11.49 | 11.51 | | 50 day SMA | 11.51 | 11.51 | 11.51 | | 100 day SMA | 10.78 | 10.76 | 10.75 | | 150 day SMA | 10.66 | 10.66 | 10.66 | | 200 day SMA | 10.89 | 10.9 | 10.91 |
|
|
