LibertyOilfield LBRT full analysis,charts,indicators,moving averages,SMA,DMA,EMA,ADX,MACD,RSILiberty Oilfield LBRT WideScreen charts, DMA,SMA,EMA technical analysis, forecast prediction, by indicators ADX,MACD,RSI,CCI USA stock exchange
operates under Energy sector & deals in Oilfield Services Equipment
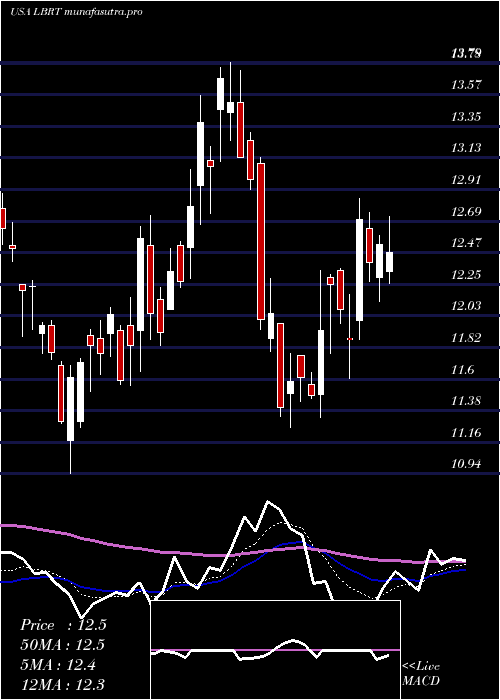
Daily price and charts and targets LibertyOilfield Strong Daily Stock price targets for LibertyOilfield LBRT are 15.34 and 17.49 | Daily Target 1 | 13.74 | | Daily Target 2 | 14.79 | | Daily Target 3 | 15.89 | | Daily Target 4 | 16.94 | | Daily Target 5 | 18.04 |
Daily price and volume Liberty Oilfield
| Date |
Closing |
Open |
Range |
Volume |
Mon 20 October 2025 |
15.84 (3.39%) |
15.43 |
14.84 - 16.99 |
1.4545 times |
Fri 17 October 2025 |
15.32 (28.31%) |
11.59 |
11.52 - 15.65 |
3.9457 times |
Thu 16 October 2025 |
11.94 (-3.24%) |
12.44 |
11.73 - 12.49 |
0.8107 times |
Wed 15 October 2025 |
12.34 (-4.71%) |
12.40 |
12.34 - 13.20 |
0.786 times |
Tue 07 October 2025 |
12.95 (-1.07%) |
13.04 |
12.61 - 13.15 |
0.579 times |
Mon 06 October 2025 |
13.09 (3.07%) |
13.22 |
12.92 - 13.51 |
0.5768 times |
Fri 03 October 2025 |
12.70 (0.08%) |
12.74 |
12.67 - 13.10 |
0.4734 times |
Thu 02 October 2025 |
12.69 (0.95%) |
12.62 |
12.40 - 12.78 |
0.4253 times |
Wed 01 October 2025 |
12.57 (1.86%) |
12.28 |
12.26 - 12.76 |
0.3994 times |
Tue 30 September 2025 |
12.34 (-2.91%) |
12.48 |
12.05 - 12.57 |
0.5491 times |
Mon 29 September 2025 |
12.71 (-0.24%) |
12.63 |
12.30 - 12.78 |
0.5942 times |
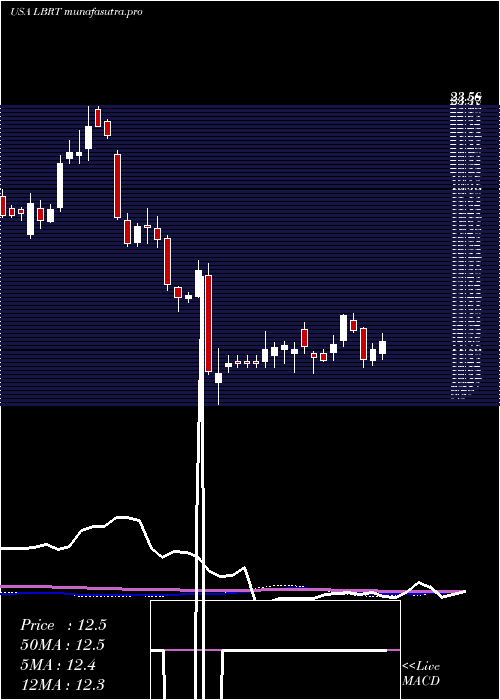
Weekly price and charts LibertyOilfield Strong weekly Stock price targets for LibertyOilfield LBRT are 15.34 and 17.49 | Weekly Target 1 | 13.74 | | Weekly Target 2 | 14.79 | | Weekly Target 3 | 15.89 | | Weekly Target 4 | 16.94 | | Weekly Target 5 | 18.04 |
Weekly price and volumes for Liberty Oilfield
| Date |
Closing |
Open |
Range |
Volume |
Mon 20 October 2025 |
15.84 (3.39%) |
15.43 |
14.84 - 16.99 |
0.5181 times |
Fri 17 October 2025 |
15.32 (20.63%) |
13.22 |
11.52 - 15.65 |
2.3859 times |
Fri 03 October 2025 |
12.70 (-0.31%) |
12.63 |
12.05 - 13.10 |
0.8697 times |
Fri 26 September 2025 |
12.74 (16.35%) |
10.80 |
10.69 - 13.05 |
1.3622 times |
Fri 19 September 2025 |
10.95 (2.43%) |
10.86 |
10.71 - 11.29 |
1.1528 times |
Fri 12 September 2025 |
10.69 (2%) |
10.50 |
9.90 - 11.46 |
1.3208 times |
Fri 05 September 2025 |
10.48 (-6.84%) |
11.17 |
10.25 - 11.24 |
0.8584 times |
Fri 29 August 2025 |
11.25 (0%) |
11.22 |
11.10 - 11.42 |
0.1376 times |
Fri 29 August 2025 |
11.25 (-1.32%) |
11.33 |
11.06 - 11.48 |
0.6989 times |
Fri 22 August 2025 |
11.40 (3.92%) |
10.93 |
10.47 - 11.43 |
0.6956 times |
Fri 15 August 2025 |
10.97 (-0.72%) |
11.06 |
10.74 - 11.48 |
0.571 times |
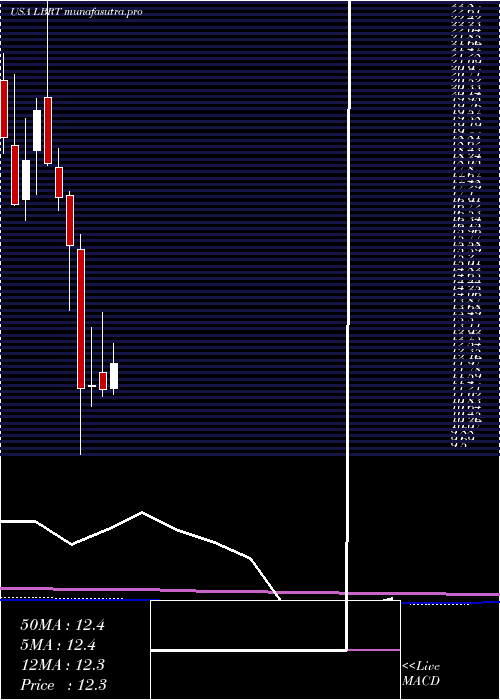
Monthly price and charts LibertyOilfield Strong monthly Stock price targets for LibertyOilfield LBRT are 13.68 and 19.15 | Monthly Target 1 | 9.31 | | Monthly Target 2 | 12.58 | | Monthly Target 3 | 14.783333333333 | | Monthly Target 4 | 18.05 | | Monthly Target 5 | 20.25 |
Monthly price and volumes Liberty Oilfield
| Date |
Closing |
Open |
Range |
Volume |
Mon 20 October 2025 |
15.84 (28.36%) |
12.28 |
11.52 - 16.99 |
0.9051 times |
Tue 30 September 2025 |
12.34 (9.69%) |
11.17 |
9.90 - 13.05 |
1.3716 times |
Fri 29 August 2025 |
11.25 (-8.83%) |
12.10 |
10.47 - 12.18 |
0.7849 times |
Thu 31 July 2025 |
12.34 (7.49%) |
11.49 |
10.96 - 14.00 |
1.3856 times |
Mon 30 June 2025 |
11.48 (-0.95%) |
11.97 |
11.26 - 13.79 |
0.8318 times |
Fri 30 May 2025 |
11.59 (0.78%) |
11.57 |
10.94 - 13.35 |
0.7888 times |
Wed 30 April 2025 |
11.50 (-27.35%) |
15.70 |
9.50 - 16.15 |
1.0936 times |
Mon 31 March 2025 |
15.83 (-8.34%) |
17.33 |
13.86 - 17.45 |
0.97 times |
Fri 28 February 2025 |
17.27 (-5.68%) |
18.19 |
16.89 - 18.76 |
0.9054 times |
Fri 31 January 2025 |
18.31 (-7.94%) |
20.29 |
18.24 - 23.58 |
0.963 times |
Tue 31 December 2024 |
19.89 (8.1%) |
18.70 |
17.35 - 20.28 |
0.6793 times |
DMA SMA EMA moving averages of Liberty Oilfield LBRT
DMA (daily moving average) of Liberty Oilfield LBRT
| DMA period | DMA value | | 5 day DMA | 13.68 | | 12 day DMA | 13.1 | | 20 day DMA | 12.51 | | 35 day DMA | 11.79 | | 50 day DMA | 11.59 | | 100 day DMA | 11.88 | | 150 day DMA | 12.15 | | 200 day DMA | 13.89 | EMA (exponential moving average) of Liberty Oilfield LBRT
| EMA period | EMA current | EMA prev | EMA prev2 | | 5 day EMA | 14.21 | 13.39 | 12.42 | | 12 day EMA | 13.28 | 12.81 | 12.35 | | 20 day EMA | 12.76 | 12.44 | 12.14 | | 35 day EMA | 12.31 | 12.1 | 11.91 | | 50 day EMA | 11.88 | 11.72 | 11.57 |
SMA (simple moving average) of Liberty Oilfield LBRT
| SMA period | SMA current | SMA prev | SMA prev2 | | 5 day SMA | 13.68 | 13.13 | 12.6 | | 12 day SMA | 13.1 | 12.81 | 12.58 | | 20 day SMA | 12.51 | 12.26 | 12.03 | | 35 day SMA | 11.79 | 11.66 | 11.55 | | 50 day SMA | 11.59 | 11.5 | 11.44 | | 100 day SMA | 11.88 | 11.84 | 11.81 | | 150 day SMA | 12.15 | 12.14 | 12.14 | | 200 day SMA | 13.89 | 13.9 | 13.92 |
|
|
