GladstoneLand LANDP full analysis,charts,indicators,moving averages,SMA,DMA,EMA,ADX,MACD,RSIGladstone Land LANDP WideScreen charts, DMA,SMA,EMA technical analysis, forecast prediction, by indicators ADX,MACD,RSI,CCI USA stock exchange
operates under Consumer Services sector & deals in Real Estate Investment Trusts
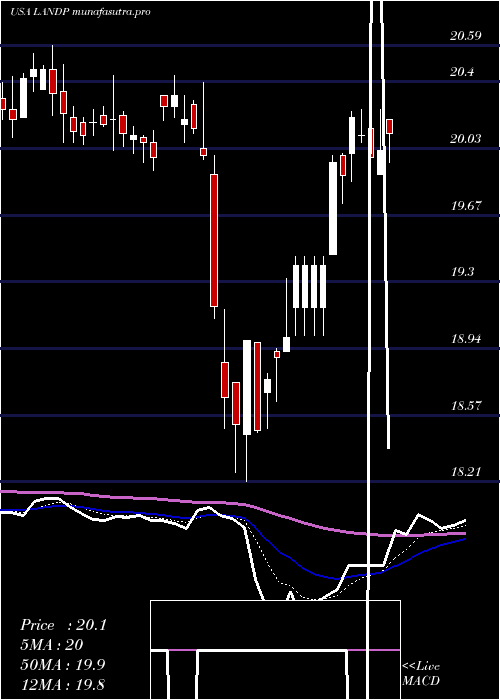
Daily price and charts and targets GladstoneLand Strong Daily Stock price targets for GladstoneLand LANDP are 19.28 and 19.52 | Daily Target 1 | 19.09 | | Daily Target 2 | 19.23 | | Daily Target 3 | 19.326666666667 | | Daily Target 4 | 19.47 | | Daily Target 5 | 19.57 |
Daily price and volume Gladstone Land
| Date |
Closing |
Open |
Range |
Volume |
Mon 20 October 2025 |
19.38 (0.68%) |
19.25 |
19.18 - 19.42 |
2.0158 times |
Fri 17 October 2025 |
19.25 (-0.52%) |
19.28 |
18.92 - 19.33 |
1.4463 times |
Thu 16 October 2025 |
19.35 (-0.36%) |
19.36 |
19.25 - 19.45 |
0.6885 times |
Wed 15 October 2025 |
19.42 (0.1%) |
19.39 |
19.32 - 19.44 |
0.7974 times |
Tue 14 October 2025 |
19.40 (0.31%) |
19.44 |
19.30 - 19.45 |
0.5002 times |
Mon 13 October 2025 |
19.34 (0.1%) |
19.34 |
19.30 - 19.45 |
0.6934 times |
Fri 10 October 2025 |
19.32 (0.1%) |
19.40 |
19.30 - 19.40 |
0.6587 times |
Thu 09 October 2025 |
19.30 (-0.26%) |
19.40 |
19.29 - 19.42 |
1.6246 times |
Wed 08 October 2025 |
19.35 (0.26%) |
19.37 |
19.29 - 19.40 |
0.8271 times |
Tue 07 October 2025 |
19.30 (-0.41%) |
19.31 |
19.29 - 19.38 |
0.7479 times |
Mon 06 October 2025 |
19.38 (-0.1%) |
19.51 |
19.32 - 19.51 |
1.8524 times |
Weekly price and charts GladstoneLand Strong weekly Stock price targets for GladstoneLand LANDP are 19.28 and 19.52 | Weekly Target 1 | 19.09 | | Weekly Target 2 | 19.23 | | Weekly Target 3 | 19.326666666667 | | Weekly Target 4 | 19.47 | | Weekly Target 5 | 19.57 |
Weekly price and volumes for Gladstone Land
| Date |
Closing |
Open |
Range |
Volume |
Mon 20 October 2025 |
19.38 (0.68%) |
19.25 |
19.18 - 19.42 |
0.4204 times |
Fri 17 October 2025 |
19.25 (-0.36%) |
19.34 |
18.92 - 19.45 |
0.8603 times |
Fri 10 October 2025 |
19.32 (-0.41%) |
19.51 |
19.29 - 19.51 |
1.1908 times |
Fri 03 October 2025 |
19.40 (-0.21%) |
19.34 |
19.31 - 19.55 |
1.4328 times |
Fri 26 September 2025 |
19.44 (-2.21%) |
19.65 |
19.31 - 20.00 |
1.1691 times |
Fri 19 September 2025 |
19.88 (-0.5%) |
19.98 |
19.58 - 20.20 |
1.3582 times |
Fri 12 September 2025 |
19.98 (2.99%) |
19.42 |
19.33 - 20.02 |
1.7506 times |
Fri 05 September 2025 |
19.40 (0.36%) |
19.35 |
19.26 - 19.62 |
0.7188 times |
Fri 29 August 2025 |
19.33 (0%) |
19.31 |
19.22 - 19.35 |
0.1756 times |
Fri 29 August 2025 |
19.33 (0.1%) |
19.29 |
19.04 - 19.35 |
0.9233 times |
Fri 22 August 2025 |
19.31 (0.05%) |
19.25 |
19.04 - 19.33 |
1.9148 times |
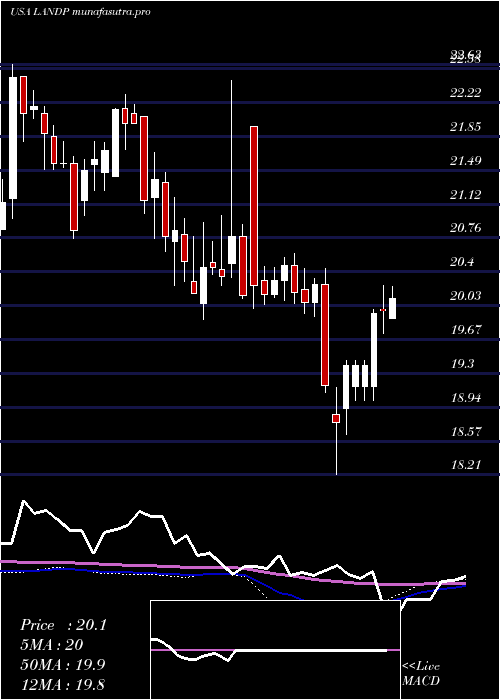
Monthly price and charts GladstoneLand Strong monthly Stock price targets for GladstoneLand LANDP are 18.84 and 19.47 | Monthly Target 1 | 18.65 | | Monthly Target 2 | 19.02 | | Monthly Target 3 | 19.283333333333 | | Monthly Target 4 | 19.65 | | Monthly Target 5 | 19.91 |
Monthly price and volumes Gladstone Land
| Date |
Closing |
Open |
Range |
Volume |
Mon 20 October 2025 |
19.38 (-0.56%) |
19.50 |
18.92 - 19.55 |
0.5971 times |
Tue 30 September 2025 |
19.49 (0.83%) |
19.35 |
19.26 - 20.20 |
1.1118 times |
Fri 29 August 2025 |
19.33 (-2.62%) |
19.90 |
19.04 - 19.95 |
1.1421 times |
Thu 31 July 2025 |
19.85 (3.12%) |
19.22 |
19.20 - 20.25 |
1.0758 times |
Mon 30 June 2025 |
19.25 (-0.82%) |
19.48 |
19.20 - 19.92 |
0.7196 times |
Fri 30 May 2025 |
19.41 (-3.19%) |
20.00 |
19.35 - 20.79 |
0.8887 times |
Wed 30 April 2025 |
20.05 (-1.33%) |
20.16 |
18.21 - 20.39 |
1.136 times |
Mon 31 March 2025 |
20.32 (0.1%) |
20.30 |
19.91 - 20.59 |
1.1193 times |
Fri 28 February 2025 |
20.30 (-2.31%) |
20.78 |
20.00 - 21.96 |
1.3313 times |
Fri 31 January 2025 |
20.78 (0.39%) |
21.02 |
19.88 - 22.45 |
0.8783 times |
Tue 31 December 2024 |
20.70 (-5.87%) |
22.07 |
20.25 - 22.07 |
1.1996 times |

DMA SMA EMA moving averages of Gladstone Land LANDP
DMA (daily moving average) of Gladstone Land LANDP
| DMA period | DMA value | | 5 day DMA | 19.36 | | 12 day DMA | 19.35 | | 20 day DMA | 19.39 | | 35 day DMA | 19.53 | | 50 day DMA | 19.45 | | 100 day DMA | 19.54 | | 150 day DMA | 19.65 | | 200 day DMA | 19.84 | EMA (exponential moving average) of Gladstone Land LANDP
| EMA period | EMA current | EMA prev | EMA prev2 | | 5 day EMA | 19.35 | 19.33 | 19.37 | | 12 day EMA | 19.37 | 19.37 | 19.39 | | 20 day EMA | 19.42 | 19.42 | 19.44 | | 35 day EMA | 19.42 | 19.42 | 19.43 | | 50 day EMA | 19.46 | 19.46 | 19.47 |
SMA (simple moving average) of Gladstone Land LANDP
| SMA period | SMA current | SMA prev | SMA prev2 | | 5 day SMA | 19.36 | 19.35 | 19.37 | | 12 day SMA | 19.35 | 19.36 | 19.37 | | 20 day SMA | 19.39 | 19.42 | 19.45 | | 35 day SMA | 19.53 | 19.53 | 19.53 | | 50 day SMA | 19.45 | 19.45 | 19.46 | | 100 day SMA | 19.54 | 19.54 | 19.55 | | 150 day SMA | 19.65 | 19.65 | 19.66 | | 200 day SMA | 19.84 | 19.85 | 19.85 |
|
|
