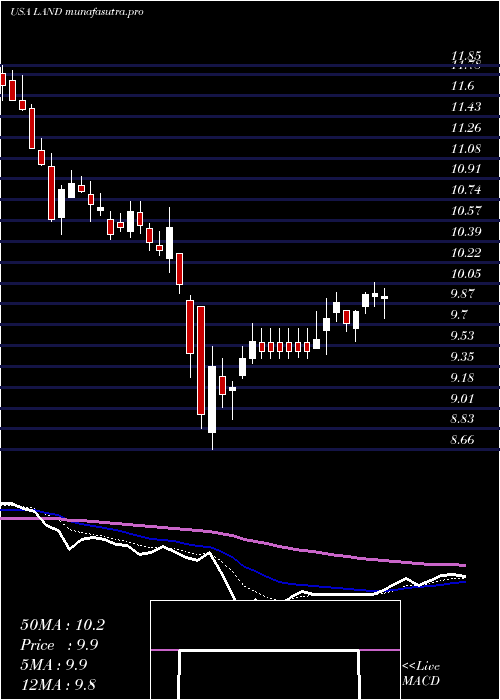
GladstoneLand LAND full analysis,charts,indicators,moving averages,SMA,DMA,EMA,ADX,MACD,RSIGladstone Land LAND WideScreen charts, DMA,SMA,EMA technical analysis, forecast prediction, by indicators ADX,MACD,RSI,CCI USA stock exchange
operates under Consumer Services sector & deals in Real Estate Investment Trusts
Daily price and charts and targets GladstoneLand Strong Daily Stock price targets for GladstoneLand LAND are 9.19 and 9.3 | Daily Target 1 | 9.11 | | Daily Target 2 | 9.16 | | Daily Target 3 | 9.2166666666667 | | Daily Target 4 | 9.27 | | Daily Target 5 | 9.33 |
Daily price and volume Gladstone Land
| Date |
Closing |
Open |
Range |
Volume |
Thu 04 December 2025 |
9.22 (0%) |
9.21 |
9.16 - 9.27 |
0.9722 times |
Wed 03 December 2025 |
9.22 (0.66%) |
9.17 |
9.12 - 9.25 |
0.898 times |
Tue 02 December 2025 |
9.16 (-0.43%) |
9.25 |
9.11 - 9.25 |
1.2609 times |
Mon 01 December 2025 |
9.20 (-1.18%) |
9.22 |
9.18 - 9.25 |
0.9524 times |
Fri 28 November 2025 |
9.31 (0.11%) |
9.28 |
9.21 - 9.33 |
0.7553 times |
Wed 26 November 2025 |
9.30 (1.2%) |
9.20 |
9.18 - 9.35 |
1.0721 times |
Tue 25 November 2025 |
9.19 (0.99%) |
9.16 |
9.16 - 9.33 |
0.9251 times |
Mon 24 November 2025 |
9.10 (-0.76%) |
9.18 |
9.08 - 9.22 |
0.7829 times |
Fri 21 November 2025 |
9.17 (2.57%) |
8.97 |
8.94 - 9.22 |
1.3069 times |
Thu 20 November 2025 |
8.94 (-1%) |
9.19 |
8.92 - 9.19 |
1.074 times |
Wed 19 November 2025 |
9.03 (-3.73%) |
9.34 |
9.00 - 9.37 |
1.1547 times |
Weekly price and charts GladstoneLand Strong weekly Stock price targets for GladstoneLand LAND are 9.14 and 9.3 | Weekly Target 1 | 9.04 | | Weekly Target 2 | 9.13 | | Weekly Target 3 | 9.2 | | Weekly Target 4 | 9.29 | | Weekly Target 5 | 9.36 |
Weekly price and volumes for Gladstone Land
| Date |
Closing |
Open |
Range |
Volume |
Thu 04 December 2025 |
9.22 (-0.97%) |
9.22 |
9.11 - 9.27 |
0.9079 times |
Fri 28 November 2025 |
9.31 (1.53%) |
9.18 |
9.08 - 9.35 |
0.786 times |
Fri 21 November 2025 |
9.17 (-4.48%) |
9.56 |
8.92 - 9.61 |
1.1411 times |
Fri 14 November 2025 |
9.60 (2.24%) |
9.43 |
9.40 - 10.07 |
1.7598 times |
Fri 07 November 2025 |
9.39 (3.64%) |
9.13 |
9.01 - 9.50 |
1.036 times |
Fri 31 October 2025 |
9.06 (0%) |
9.01 |
8.82 - 9.11 |
0.2239 times |
Fri 31 October 2025 |
9.06 (-1.09%) |
9.13 |
8.82 - 9.32 |
1.0824 times |
Fri 24 October 2025 |
9.16 (1.22%) |
9.09 |
8.84 - 9.20 |
0.947 times |
Fri 17 October 2025 |
9.05 (0.44%) |
9.15 |
9.02 - 9.40 |
1.0715 times |
Fri 10 October 2025 |
9.01 (-2.38%) |
9.23 |
8.92 - 9.23 |
1.0443 times |
Fri 03 October 2025 |
9.23 (1.21%) |
9.14 |
9.03 - 9.35 |
1.2368 times |

Monthly price and charts GladstoneLand Strong monthly Stock price targets for GladstoneLand LAND are 9.14 and 9.3 | Monthly Target 1 | 9.04 | | Monthly Target 2 | 9.13 | | Monthly Target 3 | 9.2 | | Monthly Target 4 | 9.29 | | Monthly Target 5 | 9.36 |
Monthly price and volumes Gladstone Land
| Date |
Closing |
Open |
Range |
Volume |
Thu 04 December 2025 |
9.22 (-0.97%) |
9.22 |
9.11 - 9.27 |
0.2033 times |
Fri 28 November 2025 |
9.31 (2.76%) |
9.13 |
8.92 - 10.07 |
1.0578 times |
Fri 31 October 2025 |
9.06 (-1.09%) |
9.15 |
8.82 - 9.40 |
1.1787 times |
Tue 30 September 2025 |
9.16 (-0.43%) |
9.15 |
8.77 - 9.44 |
1.1796 times |
Fri 29 August 2025 |
9.20 (0%) |
9.25 |
8.47 - 9.31 |
1.218 times |
Thu 31 July 2025 |
9.20 (-9.54%) |
10.13 |
9.17 - 10.81 |
1.3344 times |
Mon 30 June 2025 |
10.17 (2.83%) |
9.88 |
9.62 - 10.55 |
0.8527 times |
Fri 30 May 2025 |
9.89 (-0.4%) |
9.92 |
9.17 - 10.21 |
0.8906 times |
Wed 30 April 2025 |
9.93 (-5.61%) |
10.50 |
8.66 - 10.67 |
1.1548 times |
Mon 31 March 2025 |
10.52 (-8.2%) |
11.46 |
10.41 - 11.85 |
0.9301 times |
Fri 28 February 2025 |
11.46 (5.52%) |
10.81 |
10.61 - 11.93 |
1.135 times |

DMA SMA EMA moving averages of Gladstone Land LAND
DMA (daily moving average) of Gladstone Land LAND
| DMA period | DMA value | | 5 day DMA | 9.22 | | 12 day DMA | 9.19 | | 20 day DMA | 9.37 | | 35 day DMA | 9.25 | | 50 day DMA | 9.23 | | 100 day DMA | 9.25 | | 150 day DMA | 9.5 | | 200 day DMA | 9.72 | EMA (exponential moving average) of Gladstone Land LAND
| EMA period | EMA current | EMA prev | EMA prev2 | | 5 day EMA | 9.21 | 9.21 | 9.21 | | 12 day EMA | 9.25 | 9.25 | 9.25 | | 20 day EMA | 9.26 | 9.26 | 9.26 | | 35 day EMA | 9.26 | 9.26 | 9.26 | | 50 day EMA | 9.24 | 9.24 | 9.24 |
SMA (simple moving average) of Gladstone Land LAND
| SMA period | SMA current | SMA prev | SMA prev2 | | 5 day SMA | 9.22 | 9.24 | 9.23 | | 12 day SMA | 9.19 | 9.2 | 9.23 | | 20 day SMA | 9.37 | 9.37 | 9.36 | | 35 day SMA | 9.25 | 9.25 | 9.25 | | 50 day SMA | 9.23 | 9.23 | 9.23 | | 100 day SMA | 9.25 | 9.26 | 9.27 | | 150 day SMA | 9.5 | 9.5 | 9.51 | | 200 day SMA | 9.72 | 9.73 | 9.75 |
|
|
