LakelandIndustries LAKE full analysis,charts,indicators,moving averages,SMA,DMA,EMA,ADX,MACD,RSILakeland Industries LAKE WideScreen charts, DMA,SMA,EMA technical analysis, forecast prediction, by indicators ADX,MACD,RSI,CCI USA stock exchange
operates under Health Care sector & deals in Industrial Specialties
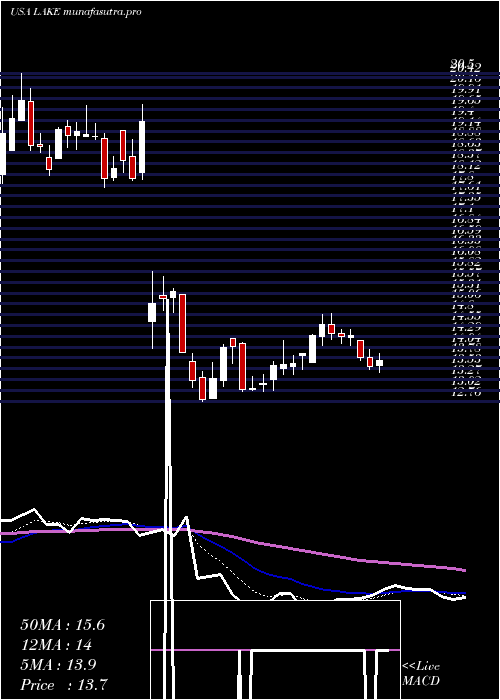
Daily price and charts and targets LakelandIndustries Strong Daily Stock price targets for LakelandIndustries LAKE are 14.87 and 15.54 | Daily Target 1 | 14.75 | | Daily Target 2 | 14.98 | | Daily Target 3 | 15.416666666667 | | Daily Target 4 | 15.65 | | Daily Target 5 | 16.09 |
Daily price and volume Lakeland Industries
| Date |
Closing |
Open |
Range |
Volume |
Thu 04 December 2025 |
15.22 (-3.55%) |
15.80 |
15.18 - 15.85 |
0.8255 times |
Wed 03 December 2025 |
15.78 (4.57%) |
15.25 |
15.00 - 15.84 |
0.8515 times |
Tue 02 December 2025 |
15.09 (1.68%) |
14.84 |
14.55 - 15.17 |
1.9402 times |
Mon 01 December 2025 |
14.84 (-2.24%) |
15.14 |
14.76 - 15.23 |
0.8905 times |
Fri 28 November 2025 |
15.18 (0.4%) |
15.24 |
15.01 - 15.24 |
0.4112 times |
Wed 26 November 2025 |
15.12 (2.3%) |
14.70 |
14.70 - 15.20 |
0.8235 times |
Tue 25 November 2025 |
14.78 (4.82%) |
14.09 |
14.09 - 14.98 |
0.9025 times |
Mon 24 November 2025 |
14.10 (-0.14%) |
14.06 |
13.99 - 14.33 |
0.9496 times |
Fri 21 November 2025 |
14.12 (3.29%) |
13.74 |
13.51 - 14.20 |
1.3078 times |
Thu 20 November 2025 |
13.67 (-1.37%) |
13.98 |
13.63 - 14.42 |
1.0977 times |
Wed 19 November 2025 |
13.86 (-4.41%) |
14.50 |
13.82 - 14.57 |
1.3228 times |
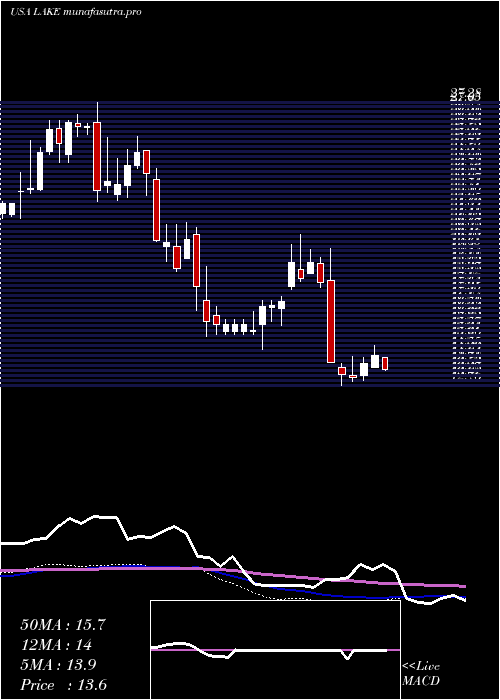
Weekly price and charts LakelandIndustries Strong weekly Stock price targets for LakelandIndustries LAKE are 14.89 and 16.19 | Weekly Target 1 | 13.91 | | Weekly Target 2 | 14.56 | | Weekly Target 3 | 15.206666666667 | | Weekly Target 4 | 15.86 | | Weekly Target 5 | 16.51 |
Weekly price and volumes for Lakeland Industries
| Date |
Closing |
Open |
Range |
Volume |
Thu 04 December 2025 |
15.22 (0.26%) |
15.14 |
14.55 - 15.85 |
0.8956 times |
Fri 28 November 2025 |
15.18 (7.51%) |
14.06 |
13.99 - 15.24 |
0.6133 times |
Fri 21 November 2025 |
14.12 (-10.46%) |
15.59 |
13.51 - 15.59 |
1.3014 times |
Fri 14 November 2025 |
15.77 (-1.07%) |
16.14 |
15.68 - 16.91 |
0.797 times |
Fri 07 November 2025 |
15.94 (-3.16%) |
16.02 |
15.69 - 16.86 |
0.5393 times |
Fri 31 October 2025 |
16.46 (0%) |
16.78 |
16.33 - 16.95 |
0.2346 times |
Fri 31 October 2025 |
16.46 (-2.02%) |
17.00 |
16.01 - 17.72 |
1.2267 times |
Fri 24 October 2025 |
16.80 (5.33%) |
16.55 |
15.90 - 16.98 |
0.7501 times |
Fri 17 October 2025 |
15.95 (-5.45%) |
17.07 |
15.51 - 17.29 |
1.1613 times |
Fri 10 October 2025 |
16.87 (9.33%) |
15.48 |
14.91 - 18.00 |
2.4806 times |
Fri 03 October 2025 |
15.43 (1.65%) |
15.27 |
14.55 - 15.43 |
1.0551 times |
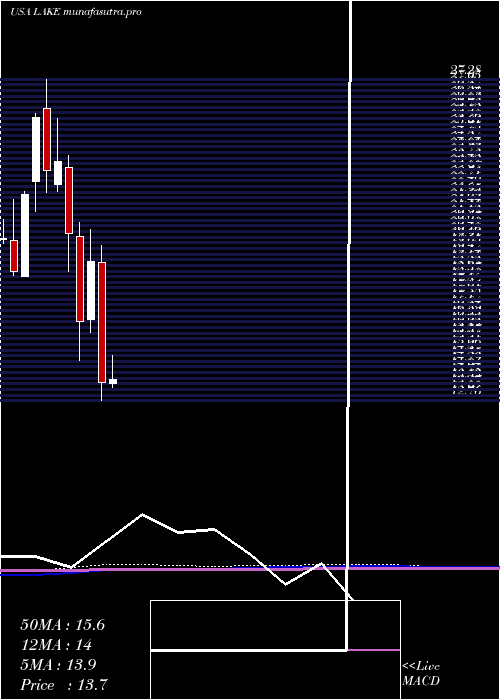
Monthly price and charts LakelandIndustries Strong monthly Stock price targets for LakelandIndustries LAKE are 14.89 and 16.19 | Monthly Target 1 | 13.91 | | Monthly Target 2 | 14.56 | | Monthly Target 3 | 15.206666666667 | | Monthly Target 4 | 15.86 | | Monthly Target 5 | 16.51 |
Monthly price and volumes Lakeland Industries
| Date |
Closing |
Open |
Range |
Volume |
Thu 04 December 2025 |
15.22 (0.26%) |
15.14 |
14.55 - 15.85 |
0.1784 times |
Fri 28 November 2025 |
15.18 (-7.78%) |
16.02 |
13.51 - 16.91 |
0.6476 times |
Fri 31 October 2025 |
16.46 (11.22%) |
14.80 |
14.63 - 18.00 |
1.2842 times |
Tue 30 September 2025 |
14.80 (-2.57%) |
14.94 |
13.57 - 15.31 |
1.1359 times |
Fri 29 August 2025 |
15.19 (9.2%) |
13.73 |
13.29 - 15.76 |
0.7064 times |
Thu 31 July 2025 |
13.91 (2.2%) |
13.54 |
13.38 - 15.22 |
1.2123 times |
Mon 30 June 2025 |
13.61 (-28.59%) |
19.01 |
12.76 - 19.77 |
2.7472 times |
Fri 30 May 2025 |
19.06 (16.72%) |
16.42 |
15.85 - 20.50 |
0.584 times |
Wed 30 April 2025 |
16.33 (-19.6%) |
20.20 |
14.58 - 20.83 |
0.7097 times |
Mon 31 March 2025 |
20.31 (-13.94%) |
23.33 |
18.61 - 23.87 |
0.7942 times |
Fri 28 February 2025 |
23.60 (1.77%) |
22.55 |
22.24 - 25.53 |
0.5074 times |
DMA SMA EMA moving averages of Lakeland Industries LAKE
DMA (daily moving average) of Lakeland Industries LAKE
| DMA period | DMA value | | 5 day DMA | 15.22 | | 12 day DMA | 14.69 | | 20 day DMA | 15.19 | | 35 day DMA | 15.71 | | 50 day DMA | 15.69 | | 100 day DMA | 15.18 | | 150 day DMA | 15.52 | | 200 day DMA | 16.43 | EMA (exponential moving average) of Lakeland Industries LAKE
| EMA period | EMA current | EMA prev | EMA prev2 | | 5 day EMA | 15.21 | 15.21 | 14.92 | | 12 day EMA | 15.1 | 15.08 | 14.95 | | 20 day EMA | 15.22 | 15.22 | 15.16 | | 35 day EMA | 15.33 | 15.34 | 15.31 | | 50 day EMA | 15.58 | 15.59 | 15.58 |
SMA (simple moving average) of Lakeland Industries LAKE
| SMA period | SMA current | SMA prev | SMA prev2 | | 5 day SMA | 15.22 | 15.2 | 15 | | 12 day SMA | 14.69 | 14.64 | 14.64 | | 20 day SMA | 15.19 | 15.26 | 15.28 | | 35 day SMA | 15.71 | 15.74 | 15.76 | | 50 day SMA | 15.69 | 15.69 | 15.67 | | 100 day SMA | 15.18 | 15.16 | 15.14 | | 150 day SMA | 15.52 | 15.53 | 15.54 | | 200 day SMA | 16.43 | 16.48 | 16.52 |
|
|
