KandiTechnologies KNDI full analysis,charts,indicators,moving averages,SMA,DMA,EMA,ADX,MACD,RSIKandi Technologies KNDI WideScreen charts, DMA,SMA,EMA technical analysis, forecast prediction, by indicators ADX,MACD,RSI,CCI USA stock exchange
operates under Capital Goods sector & deals in Auto Manufacturing
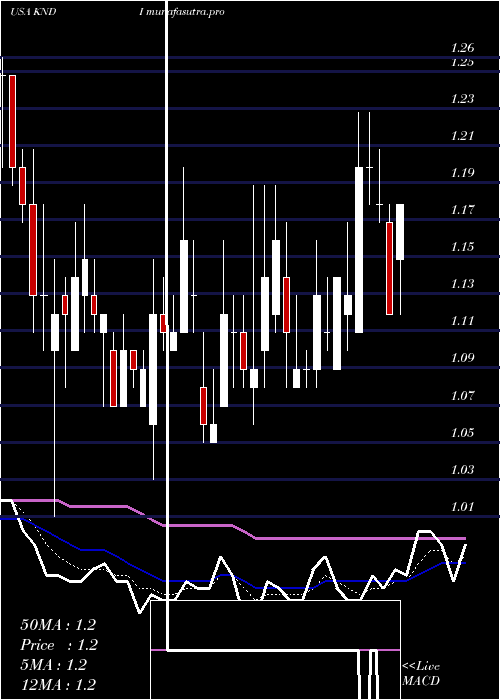
Daily price and charts and targets KandiTechnologies Strong Daily Stock price targets for KandiTechnologies KNDI are 0.94 and 1.03 | Daily Target 1 | 0.87 | | Daily Target 2 | 0.91 | | Daily Target 3 | 0.95666666666667 | | Daily Target 4 | 1 | | Daily Target 5 | 1.05 |
Daily price and volume Kandi Technologies
| Date |
Closing |
Open |
Range |
Volume |
Fri 05 December 2025 |
0.96 (4.35%) |
0.91 |
0.91 - 1.00 |
1.5553 times |
Thu 04 December 2025 |
0.92 (-2.13%) |
0.90 |
0.90 - 0.93 |
1.0992 times |
Wed 03 December 2025 |
0.94 (4.44%) |
0.90 |
0.89 - 0.95 |
1.5851 times |
Tue 02 December 2025 |
0.90 (-2.17%) |
0.91 |
0.90 - 0.93 |
0.7411 times |
Mon 01 December 2025 |
0.92 (-3.16%) |
0.94 |
0.92 - 0.95 |
1.6307 times |
Fri 28 November 2025 |
0.95 (1.06%) |
0.94 |
0.94 - 0.95 |
0.5983 times |
Wed 26 November 2025 |
0.94 (-4.08%) |
0.96 |
0.93 - 0.99 |
1.2381 times |
Tue 25 November 2025 |
0.98 (0%) |
0.96 |
0.96 - 0.99 |
0.3533 times |
Mon 24 November 2025 |
0.98 (2.08%) |
0.96 |
0.95 - 0.98 |
0.7074 times |
Fri 21 November 2025 |
0.96 (-2.04%) |
0.97 |
0.95 - 1.00 |
0.4915 times |
Thu 20 November 2025 |
0.98 (0%) |
0.95 |
0.95 - 1.00 |
0.4161 times |
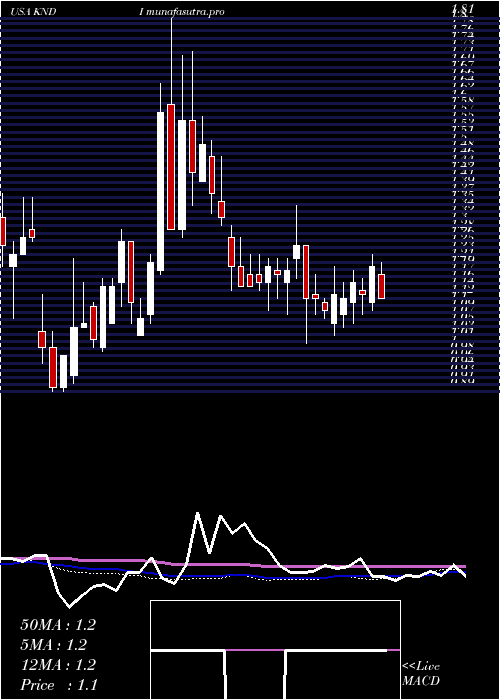
Weekly price and charts KandiTechnologies Strong weekly Stock price targets for KandiTechnologies KNDI are 0.93 and 1.04 | Weekly Target 1 | 0.84 | | Weekly Target 2 | 0.9 | | Weekly Target 3 | 0.95 | | Weekly Target 4 | 1.01 | | Weekly Target 5 | 1.06 |
Weekly price and volumes for Kandi Technologies
| Date |
Closing |
Open |
Range |
Volume |
Fri 05 December 2025 |
0.96 (1.05%) |
0.94 |
0.89 - 1.00 |
1.8985 times |
Fri 28 November 2025 |
0.95 (-1.04%) |
0.96 |
0.93 - 0.99 |
0.8319 times |
Fri 21 November 2025 |
0.96 (-6.8%) |
1.03 |
0.94 - 1.03 |
0.9209 times |
Fri 14 November 2025 |
1.03 (-4.63%) |
1.09 |
1.01 - 1.11 |
0.7496 times |
Fri 07 November 2025 |
1.08 (-6.09%) |
1.12 |
1.08 - 1.15 |
0.9754 times |
Fri 31 October 2025 |
1.15 (0%) |
1.15 |
1.15 - 1.20 |
0.17 times |
Fri 31 October 2025 |
1.15 (-7.26%) |
1.22 |
1.15 - 1.26 |
1.1049 times |
Fri 24 October 2025 |
1.24 (0%) |
1.23 |
1.21 - 1.29 |
0.7332 times |
Fri 17 October 2025 |
1.24 (0.81%) |
1.23 |
1.20 - 1.29 |
1.1275 times |
Fri 10 October 2025 |
1.23 (-4.65%) |
1.28 |
1.21 - 1.35 |
1.4882 times |
Fri 03 October 2025 |
1.29 (8.4%) |
1.20 |
1.17 - 1.30 |
1.5017 times |
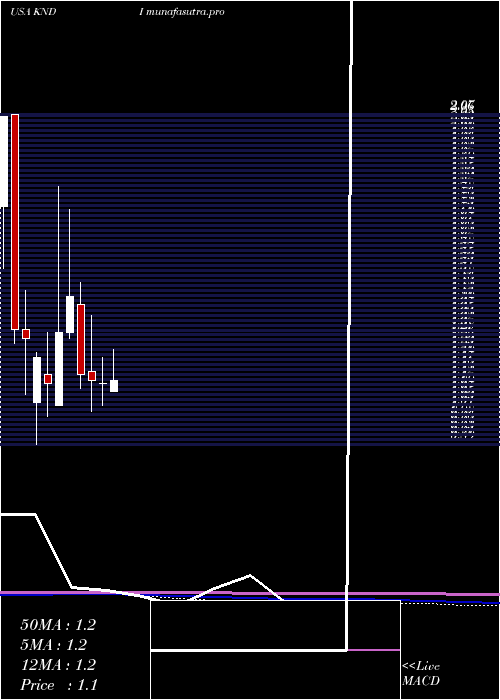
Monthly price and charts KandiTechnologies Strong monthly Stock price targets for KandiTechnologies KNDI are 0.93 and 1.04 | Monthly Target 1 | 0.84 | | Monthly Target 2 | 0.9 | | Monthly Target 3 | 0.95 | | Monthly Target 4 | 1.01 | | Monthly Target 5 | 1.06 |
Monthly price and volumes Kandi Technologies
| Date |
Closing |
Open |
Range |
Volume |
Fri 05 December 2025 |
0.96 (1.05%) |
0.94 |
0.89 - 1.00 |
0.2822 times |
Fri 28 November 2025 |
0.95 (-17.39%) |
1.12 |
0.93 - 1.15 |
0.517 times |
Fri 31 October 2025 |
1.15 (-4.96%) |
1.20 |
1.15 - 1.35 |
0.8468 times |
Tue 30 September 2025 |
1.21 (-17.12%) |
1.45 |
1.14 - 1.55 |
0.7801 times |
Fri 29 August 2025 |
1.46 (30.36%) |
1.12 |
1.10 - 1.77 |
3.3961 times |
Thu 31 July 2025 |
1.12 (0.9%) |
1.08 |
1.08 - 1.33 |
0.9294 times |
Mon 30 June 2025 |
1.11 (-0.89%) |
1.11 |
1.03 - 1.20 |
0.6232 times |
Fri 30 May 2025 |
1.12 (-1.75%) |
1.15 |
1.01 - 1.35 |
0.5959 times |
Wed 30 April 2025 |
1.14 (-19.72%) |
1.39 |
1.09 - 1.47 |
0.8146 times |
Mon 31 March 2025 |
1.42 (10.08%) |
1.29 |
1.27 - 1.73 |
1.2147 times |
Fri 28 February 2025 |
1.29 (16.22%) |
1.03 |
1.03 - 1.81 |
1.679 times |
DMA SMA EMA moving averages of Kandi Technologies KNDI
DMA (daily moving average) of Kandi Technologies KNDI
| DMA period | DMA value | | 5 day DMA | 0.93 | | 12 day DMA | 0.95 | | 20 day DMA | 0.99 | | 35 day DMA | 1.08 | | 50 day DMA | 1.12 | | 100 day DMA | 1.23 | | 150 day DMA | 1.2 | | 200 day DMA | 1.24 | EMA (exponential moving average) of Kandi Technologies KNDI
| EMA period | EMA current | EMA prev | EMA prev2 | | 5 day EMA | 0.94 | 0.93 | 0.93 | | 12 day EMA | 0.96 | 0.96 | 0.97 | | 20 day EMA | 0.98 | 0.98 | 0.99 | | 35 day EMA | 1.03 | 1.03 | 1.04 | | 50 day EMA | 1.11 | 1.12 | 1.13 |
SMA (simple moving average) of Kandi Technologies KNDI
| SMA period | SMA current | SMA prev | SMA prev2 | | 5 day SMA | 0.93 | 0.93 | 0.93 | | 12 day SMA | 0.95 | 0.95 | 0.96 | | 20 day SMA | 0.99 | 0.99 | 1 | | 35 day SMA | 1.08 | 1.08 | 1.09 | | 50 day SMA | 1.12 | 1.13 | 1.13 | | 100 day SMA | 1.23 | 1.23 | 1.23 | | 150 day SMA | 1.2 | 1.2 | 1.2 | | 200 day SMA | 1.24 | 1.24 | 1.24 |
|
|
