KennametalInc KMT full analysis,charts,indicators,moving averages,SMA,DMA,EMA,ADX,MACD,RSIKennametal Inc KMT WideScreen charts, DMA,SMA,EMA technical analysis, forecast prediction, by indicators ADX,MACD,RSI,CCI USA stock exchange
operates under Capital Goods sector & deals in Industrial Machinery Components
Daily price and charts and targets KennametalInc Strong Daily Stock price targets for KennametalInc KMT are 27.83 and 28.34 | Daily Target 1 | 27.46 | | Daily Target 2 | 27.69 | | Daily Target 3 | 27.966666666667 | | Daily Target 4 | 28.2 | | Daily Target 5 | 28.48 |
Daily price and volume Kennametal Inc
| Date |
Closing |
Open |
Range |
Volume |
Thu 04 December 2025 |
27.93 (0.11%) |
27.79 |
27.73 - 28.24 |
0.7064 times |
Wed 03 December 2025 |
27.90 (0.94%) |
27.76 |
27.52 - 28.07 |
1.0338 times |
Tue 02 December 2025 |
27.64 (0.66%) |
27.64 |
27.21 - 27.71 |
0.8847 times |
Mon 01 December 2025 |
27.46 (-0.79%) |
27.33 |
27.20 - 27.59 |
1.0626 times |
Fri 28 November 2025 |
27.68 (0.07%) |
27.80 |
27.37 - 27.83 |
0.51 times |
Wed 26 November 2025 |
27.66 (-0.5%) |
27.61 |
27.61 - 28.25 |
1.3818 times |
Tue 25 November 2025 |
27.80 (2.51%) |
27.30 |
27.15 - 27.92 |
1.0511 times |
Mon 24 November 2025 |
27.12 (1.19%) |
26.71 |
26.62 - 27.34 |
1.4007 times |
Fri 21 November 2025 |
26.80 (4.97%) |
25.71 |
25.29 - 26.81 |
1.0123 times |
Thu 20 November 2025 |
25.53 (0.31%) |
25.85 |
25.23 - 26.22 |
0.9568 times |
Wed 19 November 2025 |
25.45 (-1.24%) |
25.82 |
25.38 - 25.96 |
1.0336 times |
Weekly price and charts KennametalInc Strong weekly Stock price targets for KennametalInc KMT are 27.57 and 28.61 | Weekly Target 1 | 26.75 | | Weekly Target 2 | 27.34 | | Weekly Target 3 | 27.79 | | Weekly Target 4 | 28.38 | | Weekly Target 5 | 28.83 |
Weekly price and volumes for Kennametal Inc
| Date |
Closing |
Open |
Range |
Volume |
Thu 04 December 2025 |
27.93 (0.9%) |
27.33 |
27.20 - 28.24 |
0.7716 times |
Fri 28 November 2025 |
27.68 (3.28%) |
26.71 |
26.62 - 28.25 |
0.9089 times |
Fri 21 November 2025 |
26.80 (-0.37%) |
26.94 |
25.23 - 27.03 |
1.1484 times |
Fri 14 November 2025 |
26.90 (2.44%) |
26.40 |
26.06 - 28.43 |
1.3232 times |
Fri 07 November 2025 |
26.26 (19.64%) |
21.78 |
21.78 - 26.72 |
1.9027 times |
Fri 31 October 2025 |
21.95 (0%) |
22.27 |
21.83 - 22.39 |
0.2183 times |
Fri 31 October 2025 |
21.95 (-3.52%) |
22.87 |
21.83 - 23.22 |
1.0178 times |
Fri 24 October 2025 |
22.75 (2.66%) |
22.28 |
22.19 - 23.12 |
1.1202 times |
Fri 17 October 2025 |
22.16 (4.14%) |
20.77 |
20.70 - 22.48 |
1.329 times |
Tue 07 October 2025 |
21.28 (-2.7%) |
21.94 |
21.24 - 22.12 |
0.2597 times |
Fri 03 October 2025 |
21.87 (4.19%) |
21.12 |
20.60 - 21.97 |
0.9383 times |
Monthly price and charts KennametalInc Strong monthly Stock price targets for KennametalInc KMT are 27.57 and 28.61 | Monthly Target 1 | 26.75 | | Monthly Target 2 | 27.34 | | Monthly Target 3 | 27.79 | | Monthly Target 4 | 28.38 | | Monthly Target 5 | 28.83 |
Monthly price and volumes Kennametal Inc
| Date |
Closing |
Open |
Range |
Volume |
Thu 04 December 2025 |
27.93 (0.9%) |
27.33 |
27.20 - 28.24 |
0.1412 times |
Fri 28 November 2025 |
27.68 (26.1%) |
21.78 |
21.78 - 28.43 |
0.9665 times |
Fri 31 October 2025 |
21.95 (4.87%) |
20.78 |
20.70 - 23.22 |
0.8195 times |
Tue 30 September 2025 |
20.93 (-2.33%) |
21.26 |
20.35 - 22.16 |
0.9556 times |
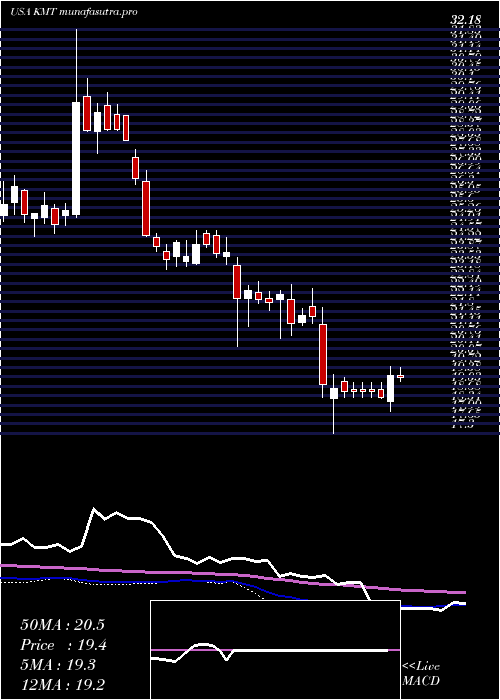
Fri 29 August 2025 |
21.43 (-13.45%) |
24.26 |
17.62 - 25.38 |
1.6866 times |
Thu 31 July 2025 |
24.76 (7.84%) |
22.95 |
22.84 - 25.75 |
0.9851 times |
Mon 30 June 2025 |
22.96 (6.64%) |
21.43 |
21.05 - 23.60 |
1.2158 times |
Fri 30 May 2025 |
21.53 (10.52%) |
19.59 |
19.39 - 22.33 |
1.0571 times |
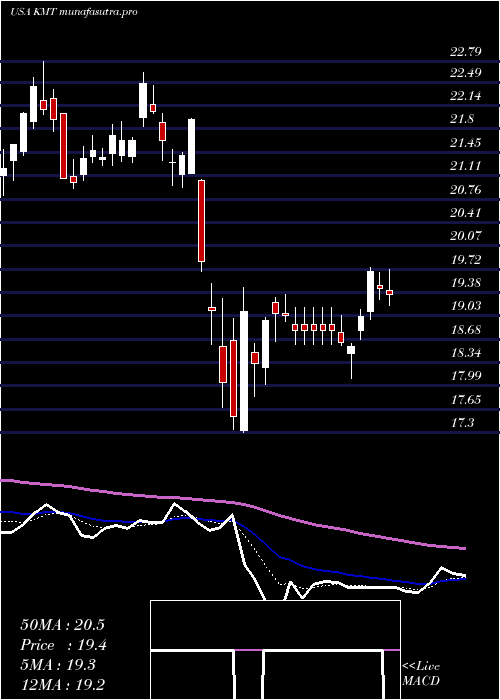
Wed 30 April 2025 |
19.48 (-8.54%) |
21.13 |
17.30 - 21.95 |
1.14 times |
Mon 31 March 2025 |
21.30 (-3.75%) |
22.22 |
20.81 - 22.79 |
1.0326 times |
Fri 28 February 2025 |
22.13 (-7.6%) |
23.48 |
20.50 - 23.78 |
1.2368 times |

DMA SMA EMA moving averages of Kennametal Inc KMT
DMA (daily moving average) of Kennametal Inc KMT
| DMA period | DMA value | | 5 day DMA | 27.72 | | 12 day DMA | 27.06 | | 20 day DMA | 27 | | 35 day DMA | 25.14 | | 50 day DMA | 23.99 | | 100 day DMA | 23.18 | | 150 day DMA | 22.74 | | 200 day DMA | 22.23 | EMA (exponential moving average) of Kennametal Inc KMT
| EMA period | EMA current | EMA prev | EMA prev2 | | 5 day EMA | 27.72 | 27.61 | 27.47 | | 12 day EMA | 27.23 | 27.1 | 26.95 | | 20 day EMA | 26.58 | 26.44 | 26.29 | | 35 day EMA | 25.45 | 25.3 | 25.15 | | 50 day EMA | 24.12 | 23.96 | 23.8 |
SMA (simple moving average) of Kennametal Inc KMT
| SMA period | SMA current | SMA prev | SMA prev2 | | 5 day SMA | 27.72 | 27.67 | 27.65 | | 12 day SMA | 27.06 | 26.89 | 26.81 | | 20 day SMA | 27 | 26.87 | 26.58 | | 35 day SMA | 25.14 | 24.98 | 24.81 | | 50 day SMA | 23.99 | 23.85 | 23.72 | | 100 day SMA | 23.18 | 23.15 | 23.11 | | 150 day SMA | 22.74 | 22.68 | 22.62 | | 200 day SMA | 22.23 | 22.21 | 22.18 |
|
|
