KingswayFinancial KFS full analysis,charts,indicators,moving averages,SMA,DMA,EMA,ADX,MACD,RSIKingsway Financial KFS WideScreen charts, DMA,SMA,EMA technical analysis, forecast prediction, by indicators ADX,MACD,RSI,CCI USA stock exchange
operates under Finance sector & deals in Property Casualty Insurers
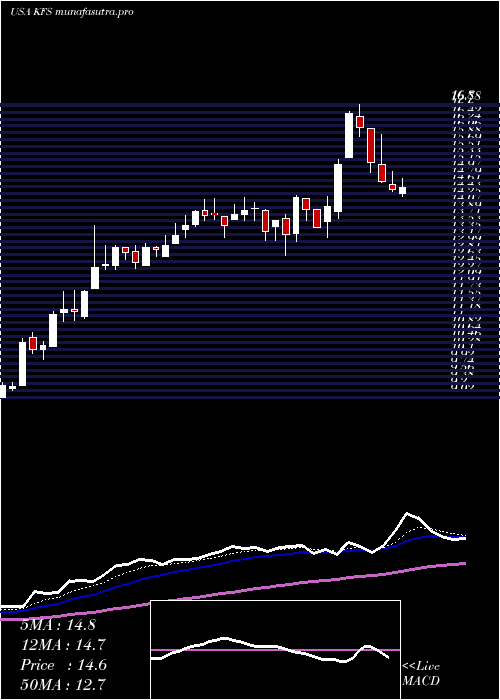
Daily price and charts and targets KingswayFinancial Strong Daily Stock price targets for KingswayFinancial KFS are 14.53 and 14.95 | Daily Target 1 | 14.19 | | Daily Target 2 | 14.45 | | Daily Target 3 | 14.61 | | Daily Target 4 | 14.87 | | Daily Target 5 | 15.03 |
Daily price and volume Kingsway Financial
| Date |
Closing |
Open |
Range |
Volume |
Mon 20 October 2025 |
14.71 (0.89%) |
14.59 |
14.35 - 14.77 |
0.7414 times |
Fri 17 October 2025 |
14.58 (-4.27%) |
15.16 |
14.52 - 15.41 |
1.3967 times |
Thu 16 October 2025 |
15.23 (-4.21%) |
16.00 |
15.23 - 16.23 |
0.9981 times |
Wed 15 October 2025 |
15.90 (0.82%) |
15.85 |
15.80 - 16.25 |
1.1196 times |
Tue 14 October 2025 |
15.77 (-2.23%) |
16.02 |
15.64 - 16.18 |
0.9107 times |
Mon 13 October 2025 |
16.13 (8.62%) |
15.36 |
15.36 - 16.51 |
2.489 times |
Tue 07 October 2025 |
14.85 (2.84%) |
14.43 |
14.22 - 14.87 |
0.8028 times |
Mon 06 October 2025 |
14.44 (-1.77%) |
14.62 |
14.36 - 14.90 |
0.3579 times |
Fri 03 October 2025 |
14.70 (0.96%) |
14.72 |
14.53 - 14.80 |
0.6977 times |
Thu 02 October 2025 |
14.56 (2.25%) |
14.23 |
13.93 - 14.66 |
0.4861 times |
Wed 01 October 2025 |
14.24 (-2.6%) |
14.47 |
14.24 - 14.65 |
0.4683 times |
Weekly price and charts KingswayFinancial Strong weekly Stock price targets for KingswayFinancial KFS are 14.53 and 14.95 | Weekly Target 1 | 14.19 | | Weekly Target 2 | 14.45 | | Weekly Target 3 | 14.61 | | Weekly Target 4 | 14.87 | | Weekly Target 5 | 15.03 |
Weekly price and volumes for Kingsway Financial
| Date |
Closing |
Open |
Range |
Volume |
Mon 20 October 2025 |
14.71 (0.89%) |
14.59 |
14.35 - 14.77 |
0.2036 times |
Fri 17 October 2025 |
14.58 (-1.82%) |
15.36 |
14.52 - 16.51 |
1.8987 times |
Tue 07 October 2025 |
14.85 (1.02%) |
14.62 |
14.22 - 14.90 |
0.3188 times |
Fri 03 October 2025 |
14.70 (0.89%) |
14.57 |
13.93 - 14.82 |
0.793 times |
Fri 26 September 2025 |
14.57 (0.97%) |
14.43 |
13.91 - 14.80 |
1.0094 times |
Fri 19 September 2025 |
14.43 (0.63%) |
14.28 |
14.19 - 14.95 |
2.9025 times |
Fri 12 September 2025 |
14.34 (2.21%) |
14.15 |
14.00 - 14.49 |
0.9707 times |
Fri 05 September 2025 |
14.03 (-2.23%) |
14.22 |
13.91 - 14.50 |
0.9329 times |
Fri 29 August 2025 |
14.35 (0%) |
14.50 |
14.28 - 14.50 |
0.162 times |
Fri 29 August 2025 |
14.35 (1.63%) |
14.01 |
13.96 - 14.50 |
0.8084 times |
Fri 22 August 2025 |
14.12 (1.44%) |
14.00 |
13.79 - 14.36 |
2.4402 times |
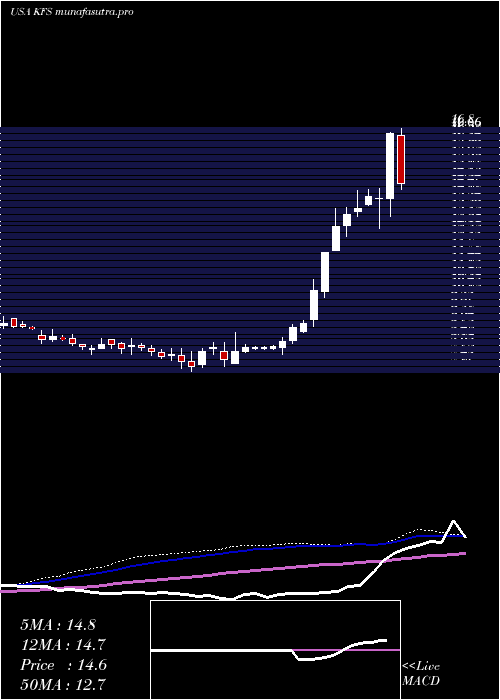
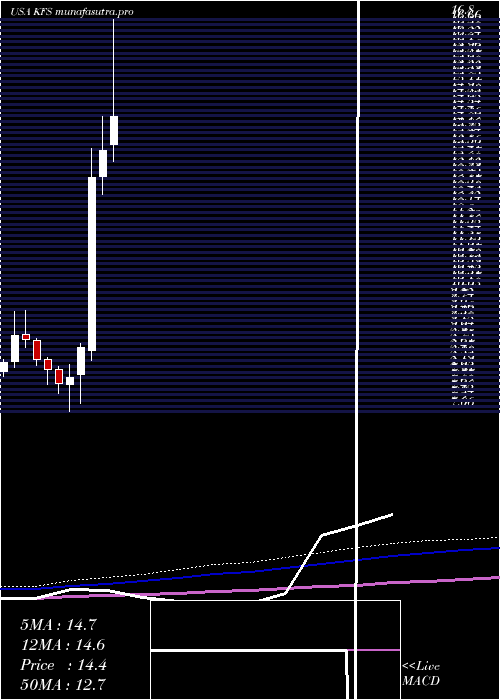
Monthly price and charts KingswayFinancial Strong monthly Stock price targets for KingswayFinancial KFS are 14.32 and 16.9 | Monthly Target 1 | 12.47 | | Monthly Target 2 | 13.59 | | Monthly Target 3 | 15.05 | | Monthly Target 4 | 16.17 | | Monthly Target 5 | 17.63 |
Monthly price and volumes Kingsway Financial
| Date |
Closing |
Open |
Range |
Volume |
Mon 20 October 2025 |
14.71 (0.62%) |
14.47 |
13.93 - 16.51 |
0.6216 times |
Tue 30 September 2025 |
14.62 (1.88%) |
14.22 |
13.91 - 14.95 |
1.3307 times |
Fri 29 August 2025 |
14.35 (2.65%) |
13.80 |
13.20 - 14.66 |
1.1748 times |
Thu 31 July 2025 |
13.98 (3.25%) |
13.70 |
13.27 - 16.80 |
1.1697 times |
Mon 30 June 2025 |
13.54 (5.29%) |
12.90 |
12.45 - 14.38 |
1.628 times |
Fri 30 May 2025 |
12.86 (48.67%) |
8.59 |
8.34 - 13.58 |
0.9318 times |
Wed 30 April 2025 |
8.65 (9.22%) |
8.00 |
7.28 - 8.76 |
0.7378 times |
Mon 31 March 2025 |
7.92 (1.93%) |
7.73 |
7.06 - 8.24 |
1.5076 times |
Fri 28 February 2025 |
7.77 (-4.07%) |
8.10 |
7.52 - 8.19 |
0.3413 times |
Fri 31 January 2025 |
8.10 (-3.23%) |
8.36 |
7.74 - 8.40 |
0.5566 times |
Tue 31 December 2024 |
8.37 (-5.53%) |
8.83 |
8.20 - 8.87 |
0.8989 times |
DMA SMA EMA moving averages of Kingsway Financial KFS
DMA (daily moving average) of Kingsway Financial KFS
| DMA period | DMA value | | 5 day DMA | 15.24 | | 12 day DMA | 14.98 | | 20 day DMA | 14.74 | | 35 day DMA | 14.54 | | 50 day DMA | 14.36 | | 100 day DMA | 14.14 | | 150 day DMA | 12.23 | | 200 day DMA | 11.16 | EMA (exponential moving average) of Kingsway Financial KFS
| EMA period | EMA current | EMA prev | EMA prev2 | | 5 day EMA | 15 | 15.15 | 15.43 | | 12 day EMA | 14.96 | 15.01 | 15.09 | | 20 day EMA | 14.81 | 14.82 | 14.85 | | 35 day EMA | 14.61 | 14.6 | 14.6 | | 50 day EMA | 14.41 | 14.4 | 14.39 |
SMA (simple moving average) of Kingsway Financial KFS
| SMA period | SMA current | SMA prev | SMA prev2 | | 5 day SMA | 15.24 | 15.52 | 15.58 | | 12 day SMA | 14.98 | 14.97 | 14.97 | | 20 day SMA | 14.74 | 14.73 | 14.72 | | 35 day SMA | 14.54 | 14.53 | 14.51 | | 50 day SMA | 14.36 | 14.36 | 14.35 | | 100 day SMA | 14.14 | 14.11 | 14.07 | | 150 day SMA | 12.23 | 12.19 | 12.14 | | 200 day SMA | 11.16 | 11.13 | 11.1 |
|
|
