KforceInc KFRC full analysis,charts,indicators,moving averages,SMA,DMA,EMA,ADX,MACD,RSIKforce Inc KFRC WideScreen charts, DMA,SMA,EMA technical analysis, forecast prediction, by indicators ADX,MACD,RSI,CCI USA stock exchange
operates under Technology sector & deals in Professional Services
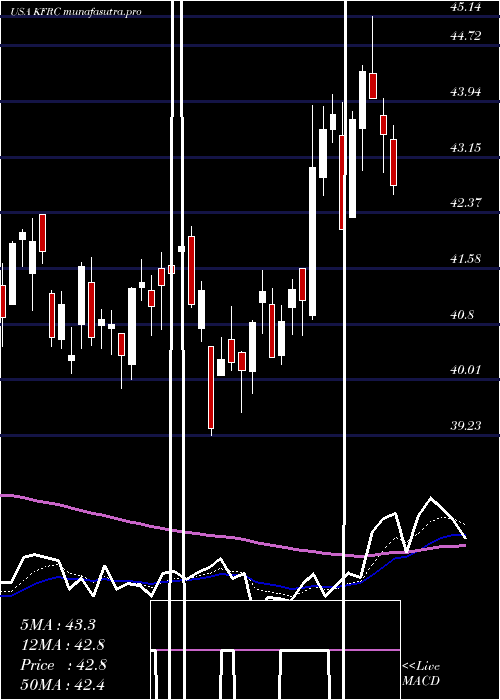
Daily price and charts and targets KforceInc Strong Daily Stock price targets for KforceInc KFRC are 29.24 and 29.95 | Daily Target 1 | 29.07 | | Daily Target 2 | 29.4 | | Daily Target 3 | 29.78 | | Daily Target 4 | 30.11 | | Daily Target 5 | 30.49 |
Daily price and volume Kforce Inc
| Date |
Closing |
Open |
Range |
Volume |
Thu 04 December 2025 |
29.73 (-1.16%) |
30.16 |
29.45 - 30.16 |
0.8162 times |
Wed 03 December 2025 |
30.08 (1.25%) |
29.74 |
29.47 - 30.42 |
1.0797 times |
Tue 02 December 2025 |
29.71 (-1.16%) |
30.04 |
29.06 - 30.30 |
0.8072 times |
Mon 01 December 2025 |
30.06 (2.24%) |
29.14 |
29.00 - 30.10 |
1.2266 times |
Fri 28 November 2025 |
29.40 (-1.01%) |
29.92 |
29.27 - 30.01 |
0.3387 times |
Wed 26 November 2025 |
29.70 (-0.27%) |
29.80 |
29.34 - 30.06 |
0.9536 times |
Tue 25 November 2025 |
29.78 (1.05%) |
29.85 |
29.70 - 30.40 |
0.7694 times |
Mon 24 November 2025 |
29.47 (-1.24%) |
29.69 |
29.04 - 29.69 |
1.4321 times |
Fri 21 November 2025 |
29.84 (5.89%) |
28.28 |
28.12 - 30.28 |
1.3159 times |
Thu 20 November 2025 |
28.18 (0.79%) |
28.22 |
27.64 - 28.82 |
1.2606 times |
Wed 19 November 2025 |
27.96 (-3.72%) |
29.23 |
27.91 - 29.68 |
1.22 times |
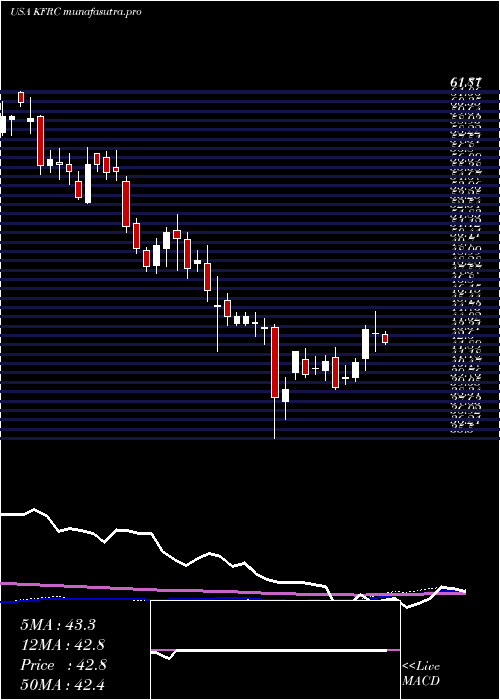
Weekly price and charts KforceInc Strong weekly Stock price targets for KforceInc KFRC are 29.37 and 30.79 | Weekly Target 1 | 28.3 | | Weekly Target 2 | 29.01 | | Weekly Target 3 | 29.716666666667 | | Weekly Target 4 | 30.43 | | Weekly Target 5 | 31.14 |
Weekly price and volumes for Kforce Inc
| Date |
Closing |
Open |
Range |
Volume |
Thu 04 December 2025 |
29.73 (1.12%) |
29.14 |
29.00 - 30.42 |
0.8186 times |
Fri 28 November 2025 |
29.40 (-1.47%) |
29.69 |
29.04 - 30.40 |
0.7278 times |
Fri 21 November 2025 |
29.84 (0.13%) |
29.82 |
27.64 - 30.28 |
1.1609 times |
Fri 14 November 2025 |
29.80 (-1.1%) |
30.40 |
29.18 - 31.47 |
1.2346 times |
Fri 07 November 2025 |
30.13 (19.09%) |
27.56 |
27.55 - 34.98 |
1.7957 times |
Fri 31 October 2025 |
25.30 (0%) |
25.00 |
24.62 - 25.39 |
0.3673 times |
Fri 31 October 2025 |
25.30 (-9.06%) |
27.91 |
24.62 - 28.13 |
1.4735 times |
Fri 24 October 2025 |
27.82 (2.13%) |
27.54 |
27.12 - 28.65 |
0.944 times |
Fri 17 October 2025 |
27.24 (-6.78%) |
27.89 |
26.90 - 28.57 |
1.0431 times |
Tue 07 October 2025 |
29.22 (-2.89%) |
30.20 |
29.20 - 30.70 |
0.4345 times |
Fri 03 October 2025 |
30.09 (0.87%) |
30.04 |
29.48 - 30.69 |
0.8724 times |
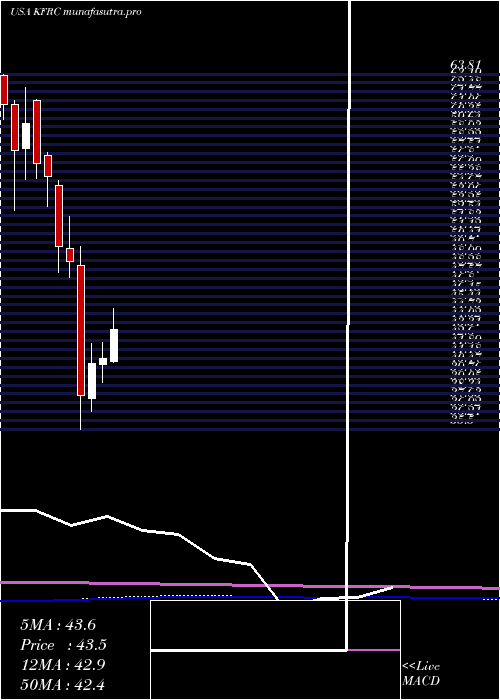
Monthly price and charts KforceInc Strong monthly Stock price targets for KforceInc KFRC are 29.37 and 30.79 | Monthly Target 1 | 28.3 | | Monthly Target 2 | 29.01 | | Monthly Target 3 | 29.716666666667 | | Monthly Target 4 | 30.43 | | Monthly Target 5 | 31.14 |
Monthly price and volumes Kforce Inc
| Date |
Closing |
Open |
Range |
Volume |
Thu 04 December 2025 |
29.73 (1.12%) |
29.14 |
29.00 - 30.42 |
0.2083 times |
Fri 28 November 2025 |
29.40 (16.21%) |
27.56 |
27.55 - 34.98 |
1.2517 times |
Fri 31 October 2025 |
25.30 (-15.61%) |
29.64 |
24.62 - 30.70 |
1.1844 times |
Tue 30 September 2025 |
29.98 (-8.04%) |
32.26 |
29.33 - 32.70 |
1.4258 times |
Fri 29 August 2025 |
32.60 (-6.46%) |
34.85 |
30.44 - 34.85 |
1.5361 times |
Thu 31 July 2025 |
34.85 (-15.27%) |
40.92 |
34.53 - 47.48 |
1.3106 times |
Mon 30 June 2025 |
41.13 (0.81%) |
40.67 |
39.23 - 42.41 |
0.6713 times |
Fri 30 May 2025 |
40.80 (6.81%) |
37.99 |
36.95 - 42.34 |
0.7684 times |
Wed 30 April 2025 |
38.20 (-21.87%) |
48.55 |
35.50 - 50.14 |
0.9235 times |
Mon 31 March 2025 |
48.89 (-2.45%) |
49.92 |
47.63 - 52.50 |
0.72 times |
Fri 28 February 2025 |
50.12 (-10.07%) |
55.00 |
48.03 - 55.40 |
0.7032 times |
DMA SMA EMA moving averages of Kforce Inc KFRC
DMA (daily moving average) of Kforce Inc KFRC
| DMA period | DMA value | | 5 day DMA | 29.8 | | 12 day DMA | 29.41 | | 20 day DMA | 29.76 | | 35 day DMA | 28.79 | | 50 day DMA | 29.04 | | 100 day DMA | 32.03 | | 150 day DMA | 34.99 | | 200 day DMA | 38.25 | EMA (exponential moving average) of Kforce Inc KFRC
| EMA period | EMA current | EMA prev | EMA prev2 | | 5 day EMA | 29.78 | 29.81 | 29.68 | | 12 day EMA | 29.63 | 29.61 | 29.52 | | 20 day EMA | 29.48 | 29.45 | 29.38 | | 35 day EMA | 29.42 | 29.4 | 29.36 | | 50 day EMA | 29.23 | 29.21 | 29.17 |
SMA (simple moving average) of Kforce Inc KFRC
| SMA period | SMA current | SMA prev | SMA prev2 | | 5 day SMA | 29.8 | 29.79 | 29.73 | | 12 day SMA | 29.41 | 29.39 | 29.37 | | 20 day SMA | 29.76 | 29.82 | 29.9 | | 35 day SMA | 28.79 | 28.73 | 28.68 | | 50 day SMA | 29.04 | 29.05 | 29.06 | | 100 day SMA | 32.03 | 32.17 | 32.31 | | 150 day SMA | 34.99 | 35.08 | 35.18 | | 200 day SMA | 38.25 | 38.35 | 38.45 |
|
|
