KewauneeScientific KEQU full analysis,charts,indicators,moving averages,SMA,DMA,EMA,ADX,MACD,RSIKewaunee Scientific KEQU WideScreen charts, DMA,SMA,EMA technical analysis, forecast prediction, by indicators ADX,MACD,RSI,CCI USA stock exchange
operates under Capital Goods sector & deals in Medical Specialities
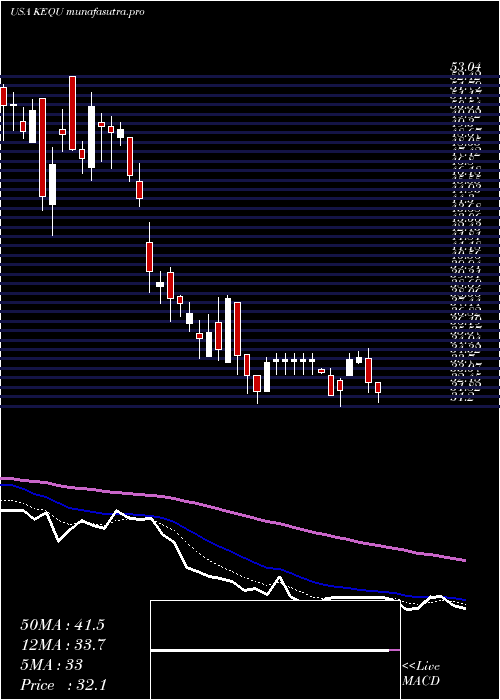
Daily price and charts and targets KewauneeScientific Strong Daily Stock price targets for KewauneeScientific KEQU are 44.33 and 47.35 | Daily Target 1 | 41.92 | | Daily Target 2 | 43.71 | | Daily Target 3 | 44.936666666667 | | Daily Target 4 | 46.73 | | Daily Target 5 | 47.96 |
Daily price and volume Kewaunee Scientific
| Date |
Closing |
Open |
Range |
Volume |
Mon 20 October 2025 |
45.51 (5.37%) |
43.59 |
43.14 - 46.16 |
1.4753 times |
Fri 17 October 2025 |
43.19 (1.62%) |
42.00 |
42.00 - 43.66 |
1.0647 times |
Thu 16 October 2025 |
42.50 (0.69%) |
42.00 |
42.00 - 43.59 |
1.6841 times |
Wed 15 October 2025 |
42.21 (1.88%) |
42.49 |
41.65 - 42.71 |
1.0786 times |
Tue 14 October 2025 |
41.43 (0.1%) |
43.16 |
41.43 - 43.16 |
0.5289 times |
Mon 13 October 2025 |
41.39 (-0.34%) |
42.16 |
41.32 - 42.16 |
0.334 times |
Fri 10 October 2025 |
41.53 (-3.73%) |
42.98 |
41.45 - 44.03 |
2.1503 times |
Thu 09 October 2025 |
43.14 (-1.57%) |
44.03 |
42.51 - 44.03 |
0.9673 times |
Wed 08 October 2025 |
43.83 (-0.16%) |
43.54 |
42.77 - 44.11 |
0.341 times |
Tue 07 October 2025 |
43.90 (0.48%) |
43.74 |
43.74 - 45.00 |
0.3758 times |
Mon 06 October 2025 |
43.69 (1.94%) |
43.33 |
43.33 - 43.69 |
0.0626 times |
Weekly price and charts KewauneeScientific Strong weekly Stock price targets for KewauneeScientific KEQU are 44.33 and 47.35 | Weekly Target 1 | 41.92 | | Weekly Target 2 | 43.71 | | Weekly Target 3 | 44.936666666667 | | Weekly Target 4 | 46.73 | | Weekly Target 5 | 47.96 |
Weekly price and volumes for Kewaunee Scientific
| Date |
Closing |
Open |
Range |
Volume |
Mon 20 October 2025 |
45.51 (5.37%) |
43.59 |
43.14 - 46.16 |
0.4143 times |
Fri 17 October 2025 |
43.19 (4%) |
42.16 |
41.32 - 43.66 |
1.3172 times |
Fri 10 October 2025 |
41.53 (-3.1%) |
43.33 |
41.45 - 45.00 |
1.0944 times |
Fri 03 October 2025 |
42.86 (-2.01%) |
43.70 |
42.65 - 44.30 |
0.6898 times |
Fri 26 September 2025 |
43.74 (-0.61%) |
43.62 |
42.85 - 44.47 |
0.5863 times |
Fri 19 September 2025 |
44.01 (3.82%) |
42.51 |
42.51 - 46.70 |
1.6787 times |
Fri 12 September 2025 |
42.39 (-21.11%) |
54.01 |
42.03 - 57.88 |
3.0897 times |
Fri 05 September 2025 |
53.73 (-5.22%) |
56.09 |
53.50 - 56.20 |
0.6684 times |
Fri 29 August 2025 |
56.69 (0%) |
57.00 |
56.69 - 58.95 |
0.084 times |
Fri 29 August 2025 |
56.69 (-1.7%) |
57.92 |
55.32 - 59.00 |
0.3772 times |
Fri 22 August 2025 |
57.67 (6.68%) |
54.88 |
54.88 - 60.89 |
0.5433 times |
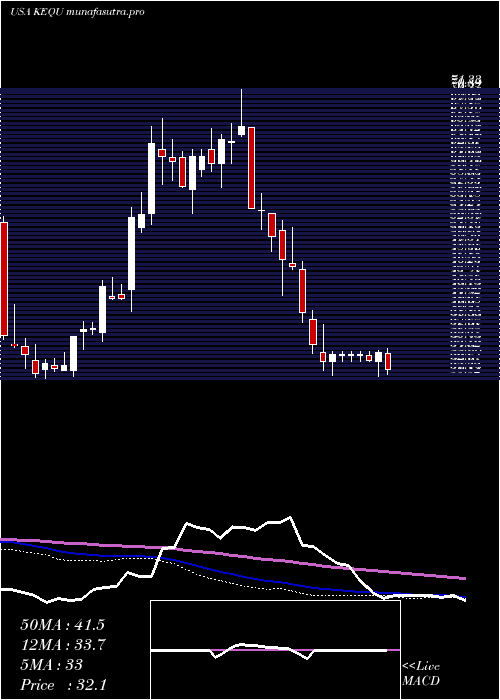
Monthly price and charts KewauneeScientific Strong monthly Stock price targets for KewauneeScientific KEQU are 43.42 and 48.26 | Monthly Target 1 | 39.49 | | Monthly Target 2 | 42.5 | | Monthly Target 3 | 44.33 | | Monthly Target 4 | 47.34 | | Monthly Target 5 | 49.17 |
Monthly price and volumes Kewaunee Scientific
| Date |
Closing |
Open |
Range |
Volume |
Mon 20 October 2025 |
45.51 (6.71%) |
43.20 |
41.32 - 46.16 |
0.5024 times |
Tue 30 September 2025 |
42.65 (-24.77%) |
56.09 |
42.03 - 57.88 |
0.9669 times |
Fri 29 August 2025 |
56.69 (2.44%) |
55.00 |
52.25 - 60.89 |
0.4654 times |
Thu 31 July 2025 |
55.34 (-5.72%) |
58.19 |
53.00 - 60.00 |
0.7545 times |
Mon 30 June 2025 |
58.70 (52.63%) |
38.10 |
36.05 - 60.00 |
0.8726 times |
Fri 30 May 2025 |
38.46 (21.44%) |
32.20 |
30.78 - 40.49 |
0.6141 times |
Wed 30 April 2025 |
31.67 (-19.58%) |
40.06 |
30.33 - 40.38 |
1.126 times |
Mon 31 March 2025 |
39.38 (-27.56%) |
54.00 |
38.00 - 54.00 |
1.6934 times |
Fri 28 February 2025 |
54.36 (-15.46%) |
63.90 |
51.68 - 71.33 |
1.4148 times |
Fri 31 January 2025 |
64.30 (3.93%) |
61.37 |
54.02 - 65.83 |
1.5901 times |
Tue 31 December 2024 |
61.87 (46.92%) |
43.31 |
40.32 - 67.20 |
1.7439 times |

DMA SMA EMA moving averages of Kewaunee Scientific KEQU
DMA (daily moving average) of Kewaunee Scientific KEQU
| DMA period | DMA value | | 5 day DMA | 42.97 | | 12 day DMA | 42.93 | | 20 day DMA | 43.14 | | 35 day DMA | 45.71 | | 50 day DMA | 48.94 | | 100 day DMA | 49.51 | | 150 day DMA | 45.22 | | 200 day DMA | 48.54 | EMA (exponential moving average) of Kewaunee Scientific KEQU
| EMA period | EMA current | EMA prev | EMA prev2 | | 5 day EMA | 43.54 | 42.55 | 42.23 | | 12 day EMA | 43.25 | 42.84 | 42.78 | | 20 day EMA | 43.9 | 43.73 | 43.79 | | 35 day EMA | 46.24 | 46.28 | 46.46 | | 50 day EMA | 48.78 | 48.91 | 49.14 |
SMA (simple moving average) of Kewaunee Scientific KEQU
| SMA period | SMA current | SMA prev | SMA prev2 | | 5 day SMA | 42.97 | 42.14 | 41.81 | | 12 day SMA | 42.93 | 42.75 | 42.83 | | 20 day SMA | 43.14 | 43.07 | 43.11 | | 35 day SMA | 45.71 | 46.03 | 46.42 | | 50 day SMA | 48.94 | 49.13 | 49.32 | | 100 day SMA | 49.51 | 49.44 | 49.37 | | 150 day SMA | 45.22 | 45.23 | 45.27 | | 200 day SMA | 48.54 | 48.62 | 48.72 |
|
|
