KoreaElectric KEP full analysis,charts,indicators,moving averages,SMA,DMA,EMA,ADX,MACD,RSIKorea Electric KEP WideScreen charts, DMA,SMA,EMA technical analysis, forecast prediction, by indicators ADX,MACD,RSI,CCI USA stock exchange
operates under Public Utilities sector & deals in Electric Utilities Central
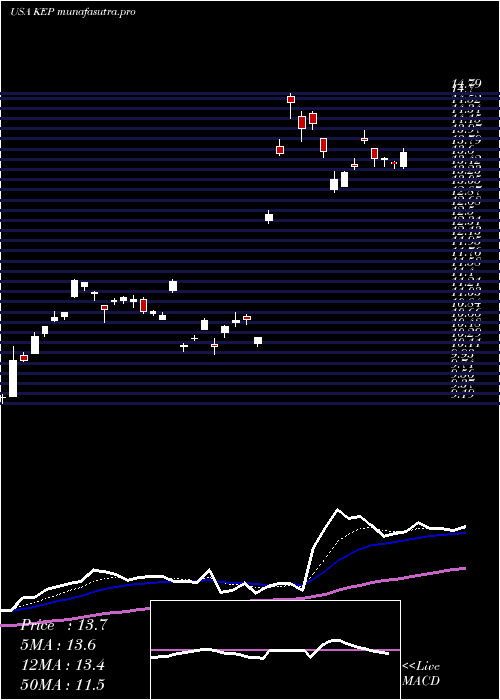
Daily price and charts and targets KoreaElectric Strong Daily Stock price targets for KoreaElectric KEP are 17.03 and 17.25 | Daily Target 1 | 16.99 | | Daily Target 2 | 17.07 | | Daily Target 3 | 17.21 | | Daily Target 4 | 17.29 | | Daily Target 5 | 17.43 |
Daily price and volume Korea Electric
| Date |
Closing |
Open |
Range |
Volume |
Thu 04 December 2025 |
17.15 (-1.61%) |
17.26 |
17.13 - 17.35 |
0.5619 times |
Wed 03 December 2025 |
17.43 (0.23%) |
17.61 |
17.33 - 17.68 |
0.773 times |
Tue 02 December 2025 |
17.39 (0.75%) |
17.40 |
17.29 - 17.54 |
0.431 times |
Mon 01 December 2025 |
17.26 (-5.22%) |
17.30 |
17.10 - 17.39 |
1.4549 times |
Fri 28 November 2025 |
18.21 (-0.27%) |
18.20 |
18.04 - 18.21 |
0.739 times |
Wed 26 November 2025 |
18.26 (2.3%) |
18.02 |
18.01 - 18.29 |
0.8689 times |
Tue 25 November 2025 |
17.85 (3.78%) |
17.59 |
17.40 - 18.26 |
1.4556 times |
Mon 24 November 2025 |
17.20 (2.75%) |
16.59 |
16.35 - 17.26 |
1.2009 times |
Fri 21 November 2025 |
16.74 (0.06%) |
16.55 |
16.46 - 16.82 |
1.052 times |
Thu 20 November 2025 |
16.73 (0.9%) |
17.17 |
16.70 - 17.35 |
1.4628 times |
Wed 19 November 2025 |
16.58 (-2.98%) |
16.23 |
16.18 - 16.59 |
1.2075 times |
Weekly price and charts KoreaElectric Strong weekly Stock price targets for KoreaElectric KEP are 16.84 and 17.42 | Weekly Target 1 | 16.73 | | Weekly Target 2 | 16.94 | | Weekly Target 3 | 17.31 | | Weekly Target 4 | 17.52 | | Weekly Target 5 | 17.89 |
Weekly price and volumes for Korea Electric
| Date |
Closing |
Open |
Range |
Volume |
Thu 04 December 2025 |
17.15 (-5.82%) |
17.30 |
17.10 - 17.68 |
0.8053 times |
Fri 28 November 2025 |
18.21 (8.78%) |
16.59 |
16.35 - 18.29 |
1.0663 times |
Fri 21 November 2025 |
16.74 (1.39%) |
16.86 |
16.18 - 17.35 |
1.4239 times |
Fri 14 November 2025 |
16.51 (8.19%) |
16.01 |
15.95 - 17.00 |
1.3046 times |
Fri 07 November 2025 |
15.26 (1.26%) |
15.51 |
14.95 - 16.10 |
0.9452 times |
Fri 31 October 2025 |
15.07 (0%) |
15.02 |
14.91 - 15.07 |
0.1866 times |
Fri 31 October 2025 |
15.07 (-0.99%) |
15.29 |
14.87 - 16.25 |
1.3003 times |
Fri 24 October 2025 |
15.22 (-0.59%) |
15.08 |
14.69 - 15.45 |
1.332 times |
Fri 17 October 2025 |
15.31 (20.55%) |
12.73 |
12.63 - 15.31 |
1.392 times |
Tue 07 October 2025 |
12.70 (-0.63%) |
13.12 |
12.70 - 13.12 |
0.2437 times |
Fri 03 October 2025 |
12.78 (-1.62%) |
13.28 |
12.70 - 13.30 |
0.8163 times |
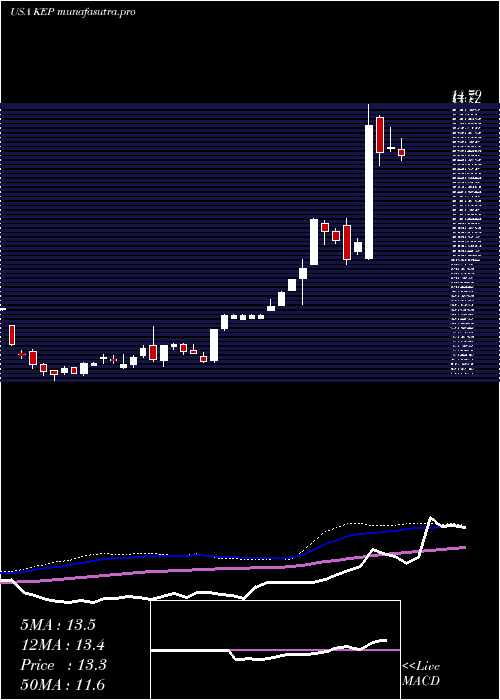
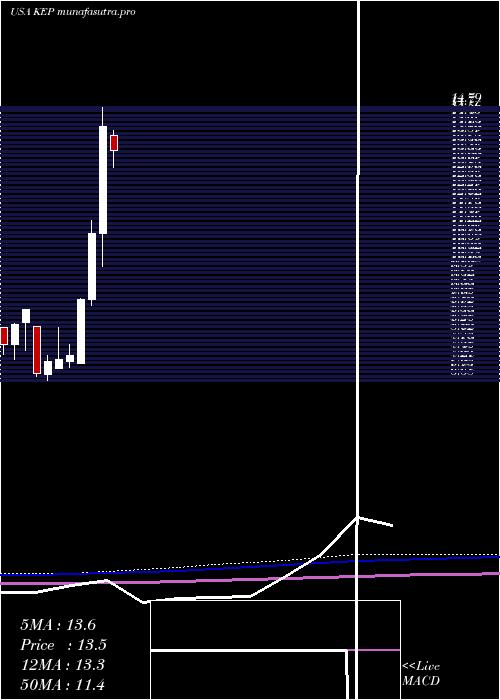
Monthly price and charts KoreaElectric Strong monthly Stock price targets for KoreaElectric KEP are 16.84 and 17.42 | Monthly Target 1 | 16.73 | | Monthly Target 2 | 16.94 | | Monthly Target 3 | 17.31 | | Monthly Target 4 | 17.52 | | Monthly Target 5 | 17.89 |
Monthly price and volumes Korea Electric
| Date |
Closing |
Open |
Range |
Volume |
Thu 04 December 2025 |
17.15 (-5.82%) |
17.30 |
17.10 - 17.68 |
0.158 times |
Fri 28 November 2025 |
18.21 (20.84%) |
15.51 |
14.95 - 18.29 |
0.9302 times |
Fri 31 October 2025 |
15.07 (15.48%) |
12.85 |
12.63 - 16.25 |
0.962 times |
Tue 30 September 2025 |
13.05 (-1.21%) |
13.12 |
12.80 - 14.13 |
1.0479 times |
Fri 29 August 2025 |
13.21 (-3.86%) |
13.04 |
13.03 - 15.19 |
1.4464 times |
Thu 31 July 2025 |
13.74 (-3.51%) |
13.97 |
13.01 - 14.47 |
1.4923 times |
Mon 30 June 2025 |
14.24 (28.87%) |
11.05 |
10.08 - 14.79 |
2.0219 times |
Fri 30 May 2025 |
11.05 (21.56%) |
9.08 |
8.90 - 11.43 |
1.0051 times |
Wed 30 April 2025 |
9.09 (22.67%) |
7.19 |
7.19 - 9.11 |
0.5704 times |
Mon 31 March 2025 |
7.41 (1.51%) |
7.25 |
7.08 - 7.76 |
0.3659 times |
Fri 28 February 2025 |
7.30 (0.69%) |
7.05 |
7.03 - 8.25 |
0.3943 times |
DMA SMA EMA moving averages of Korea Electric KEP
DMA (daily moving average) of Korea Electric KEP
| DMA period | DMA value | | 5 day DMA | 17.49 | | 12 day DMA | 17.32 | | 20 day DMA | 16.91 | | 35 day DMA | 16.18 | | 50 day DMA | 15.26 | | 100 day DMA | 14.47 | | 150 day DMA | 13.34 | | 200 day DMA | 11.97 | EMA (exponential moving average) of Korea Electric KEP
| EMA period | EMA current | EMA prev | EMA prev2 | | 5 day EMA | 17.38 | 17.5 | 17.53 | | 12 day EMA | 17.23 | 17.24 | 17.21 | | 20 day EMA | 16.86 | 16.83 | 16.77 | | 35 day EMA | 16.11 | 16.05 | 15.97 | | 50 day EMA | 15.31 | 15.24 | 15.15 |
SMA (simple moving average) of Korea Electric KEP
| SMA period | SMA current | SMA prev | SMA prev2 | | 5 day SMA | 17.49 | 17.71 | 17.79 | | 12 day SMA | 17.32 | 17.3 | 17.23 | | 20 day SMA | 16.91 | 16.82 | 16.73 | | 35 day SMA | 16.18 | 16.09 | 15.98 | | 50 day SMA | 15.26 | 15.17 | 15.09 | | 100 day SMA | 14.47 | 14.44 | 14.4 | | 150 day SMA | 13.34 | 13.28 | 13.23 | | 200 day SMA | 11.97 | 11.92 | 11.87 |
|
|
