KellyServices KELYB full analysis,charts,indicators,moving averages,SMA,DMA,EMA,ADX,MACD,RSIKelly Services KELYB WideScreen charts, DMA,SMA,EMA technical analysis, forecast prediction, by indicators ADX,MACD,RSI,CCI USA stock exchange
operates under Technology sector & deals in Professional Services
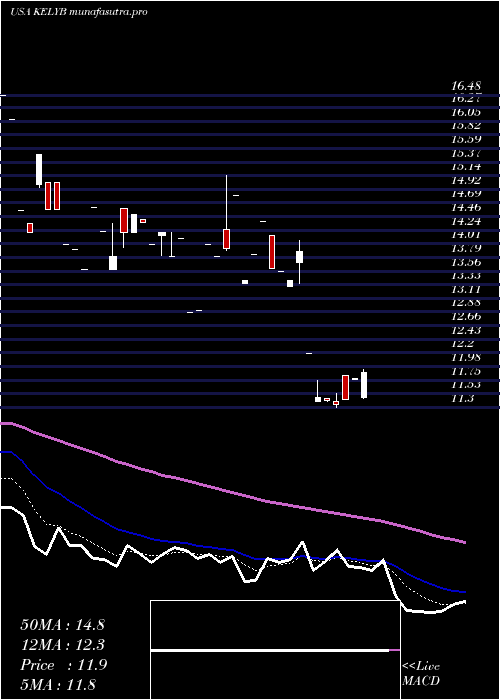
Daily price and charts and targets KellyServices Strong Daily Stock price targets for KellyServices KELYB are 8.69 and 8.71 | Daily Target 1 | 8.69 | | Daily Target 2 | 8.69 | | Daily Target 3 | 8.7066666666667 | | Daily Target 4 | 8.71 | | Daily Target 5 | 8.73 |
Daily price and volume Kelly Services
| Date |
Closing |
Open |
Range |
Volume |
Thu 04 December 2025 |
8.70 (-1.14%) |
8.72 |
8.70 - 8.72 |
0.9091 times |
Wed 03 December 2025 |
8.80 (0%) |
8.65 |
8.65 - 8.80 |
1.6667 times |
Fri 21 November 2025 |
8.80 (-1.12%) |
8.80 |
8.80 - 8.80 |
0.303 times |
Fri 14 November 2025 |
8.90 (-2.2%) |
8.82 |
8.82 - 8.90 |
0.9091 times |
Mon 10 November 2025 |
9.10 (-17.72%) |
9.78 |
9.09 - 9.78 |
4.3939 times |
Thu 30 October 2025 |
11.06 (-6.11%) |
11.06 |
11.06 - 11.06 |
0.4545 times |
Wed 29 October 2025 |
11.78 (-5.23%) |
11.78 |
11.78 - 11.78 |
0.4545 times |
Thu 23 October 2025 |
12.43 (-4.02%) |
12.43 |
12.43 - 12.43 |
0.303 times |
Wed 22 October 2025 |
12.95 (7.02%) |
12.95 |
12.95 - 12.95 |
0.1515 times |
Mon 20 October 2025 |
12.10 (-3.43%) |
12.10 |
12.10 - 12.10 |
0.4545 times |
Tue 14 October 2025 |
12.53 (-0.56%) |
12.53 |
12.53 - 12.53 |
0.303 times |
Weekly price and charts KellyServices Strong weekly Stock price targets for KellyServices KELYB are 8.68 and 8.83 | Weekly Target 1 | 8.57 | | Weekly Target 2 | 8.63 | | Weekly Target 3 | 8.7166666666667 | | Weekly Target 4 | 8.78 | | Weekly Target 5 | 8.87 |
Weekly price and volumes for Kelly Services
| Date |
Closing |
Open |
Range |
Volume |
Thu 04 December 2025 |
8.70 (-1.14%) |
8.65 |
8.65 - 8.80 |
1.5741 times |
Fri 21 November 2025 |
8.80 (-1.12%) |
8.80 |
8.80 - 8.80 |
0.1852 times |
Fri 14 November 2025 |
8.90 (-19.53%) |
9.78 |
8.82 - 9.78 |
3.2407 times |
Thu 30 October 2025 |
11.06 (-11.02%) |
11.78 |
11.06 - 11.78 |
0.5556 times |
Thu 23 October 2025 |
12.43 (-0.8%) |
12.10 |
12.10 - 12.95 |
0.5556 times |
Tue 14 October 2025 |
12.53 (-3.84%) |
12.60 |
12.53 - 12.60 |
0.5556 times |
Wed 08 October 2025 |
13.03 (-1.66%) |
12.96 |
12.65 - 13.47 |
0.7407 times |
Fri 03 October 2025 |
13.25 (-4.26%) |
14.45 |
13.25 - 14.45 |
0.463 times |
Fri 12 September 2025 |
13.84 (-5.98%) |
14.60 |
13.71 - 14.60 |
0.6481 times |
Fri 22 August 2025 |
14.72 (5.75%) |
14.00 |
13.86 - 15.05 |
1.4815 times |
Fri 15 August 2025 |
13.92 (11.36%) |
11.94 |
11.94 - 14.84 |
10.463 times |
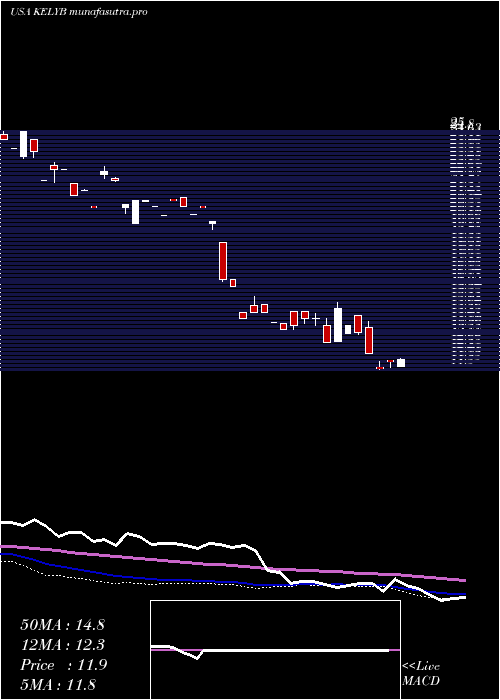
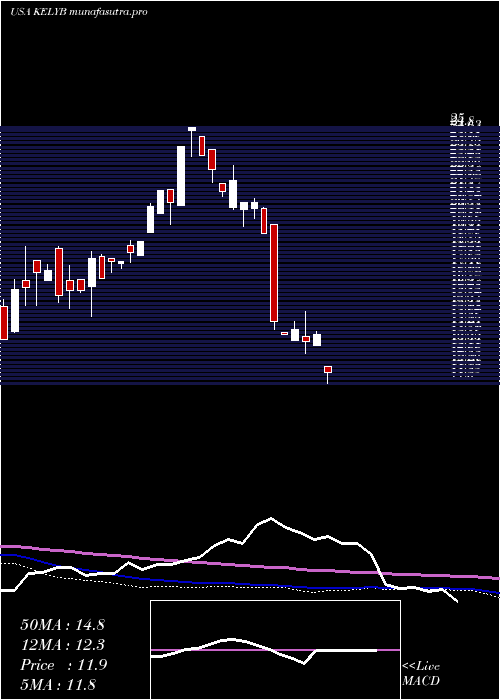
Monthly price and charts KellyServices Strong monthly Stock price targets for KellyServices KELYB are 8.68 and 8.83 | Monthly Target 1 | 8.57 | | Monthly Target 2 | 8.63 | | Monthly Target 3 | 8.7166666666667 | | Monthly Target 4 | 8.78 | | Monthly Target 5 | 8.87 |
Monthly price and volumes Kelly Services
| Date |
Closing |
Open |
Range |
Volume |
Thu 04 December 2025 |
8.70 (-1.14%) |
8.65 |
8.65 - 8.80 |
0.2883 times |
Fri 21 November 2025 |
8.80 (-20.43%) |
9.78 |
8.80 - 9.78 |
0.6275 times |
Thu 30 October 2025 |
11.06 (-23.46%) |
13.25 |
11.06 - 13.47 |
0.5088 times |
Tue 23 September 2025 |
14.45 (-1.03%) |
13.71 |
13.71 - 14.45 |
0.1018 times |
Tue 26 August 2025 |
14.60 (16.8%) |
11.94 |
11.94 - 15.05 |
2.2216 times |
Thu 31 July 2025 |
12.50 (3.39%) |
12.09 |
11.81 - 14.24 |
2.7587 times |
Mon 30 June 2025 |
12.09 (5.59%) |
11.46 |
11.44 - 12.60 |
0.5257 times |
Wed 28 May 2025 |
11.45 (3.71%) |
11.32 |
11.32 - 12.75 |
0.8479 times |
Wed 30 April 2025 |
11.04 (-20.52%) |
12.20 |
11.04 - 12.20 |
1.3228 times |
Wed 19 March 2025 |
13.89 (2.51%) |
13.31 |
13.31 - 14.07 |
0.7971 times |
Thu 27 February 2025 |
13.55 (-4.58%) |
13.80 |
12.87 - 15.15 |
1.8824 times |
DMA SMA EMA moving averages of Kelly Services KELYB
DMA (daily moving average) of Kelly Services KELYB
| DMA period | DMA value | | 5 day DMA | 8.86 | | 12 day DMA | 10.81 | | 20 day DMA | 11.97 | | 35 day DMA | 12.57 | | 50 day DMA | 12.39 | | 100 day DMA | 13.58 | | 150 day DMA | 16.32 | | 200 day DMA | 16.53 | EMA (exponential moving average) of Kelly Services KELYB
| EMA period | EMA current | EMA prev | EMA prev2 | | 5 day EMA | 9.21 | 9.46 | 9.79 | | 12 day EMA | 10.43 | 10.75 | 11.1 | | 20 day EMA | 11.24 | 11.51 | 11.79 | | 35 day EMA | 11.72 | 11.9 | 12.08 | | 50 day EMA | 11.98 | 12.11 | 12.24 |
SMA (simple moving average) of Kelly Services KELYB
| SMA period | SMA current | SMA prev | SMA prev2 | | 5 day SMA | 8.86 | 9.33 | 9.93 | | 12 day SMA | 10.81 | 11.17 | 11.54 | | 20 day SMA | 11.97 | 12.27 | 12.53 | | 35 day SMA | 12.57 | 12.68 | 12.77 | | 50 day SMA | 12.39 | 12.44 | 12.5 | | 100 day SMA | 13.58 | 13.7 | 13.81 | | 150 day SMA | 16.32 | 16.39 | 16.46 | | 200 day SMA | 16.53 | 16.57 | 16.62 |
|
|
