InvescoKbw KBWR full analysis,charts,indicators,moving averages,SMA,DMA,EMA,ADX,MACD,RSIInvesco Kbw KBWR WideScreen charts, DMA,SMA,EMA technical analysis, forecast prediction, by indicators ADX,MACD,RSI,CCI USA stock exchange
operates under N A sector & deals in N A
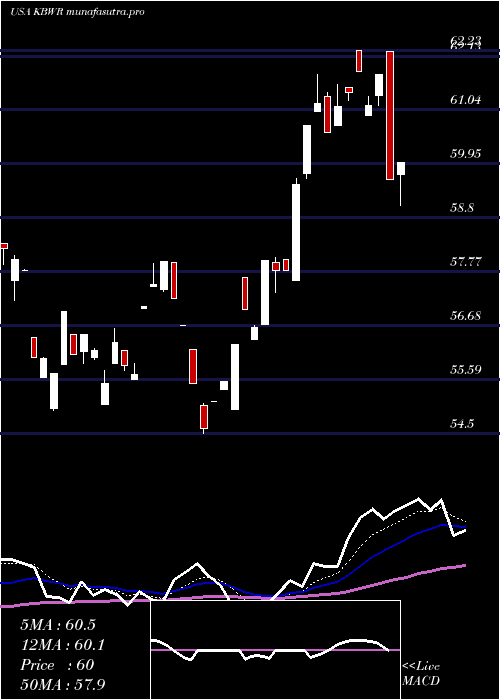
Daily price and charts and targets InvescoKbw Strong Daily Stock price targets for InvescoKbw KBWR are 62.06 and 62.06 | Daily Target 1 | 62.06 | | Daily Target 2 | 62.06 | | Daily Target 3 | 62.06 | | Daily Target 4 | 62.06 | | Daily Target 5 | 62.06 |
Daily price and volume Invesco Kbw
| Date |
Closing |
Open |
Range |
Volume |
Thu 04 December 2025 |
62.06 (0.16%) |
62.06 |
62.06 - 62.06 |
0.1812 times |
Wed 03 December 2025 |
61.96 (1.89%) |
61.91 |
61.91 - 61.96 |
0.1449 times |
Tue 02 December 2025 |
60.81 (-0.67%) |
61.55 |
60.81 - 61.55 |
1.0507 times |
Mon 01 December 2025 |
61.22 (1.11%) |
59.83 |
59.83 - 61.29 |
3.442 times |
Fri 28 November 2025 |
60.55 (-0.49%) |
60.85 |
60.55 - 60.85 |
0.2899 times |
Wed 26 November 2025 |
60.85 (-0.51%) |
60.93 |
60.85 - 61.31 |
0.471 times |
Tue 25 November 2025 |
61.16 (2.95%) |
60.00 |
60.00 - 61.25 |
2.3913 times |
Mon 24 November 2025 |
59.41 (0.13%) |
59.02 |
59.02 - 59.44 |
0.8696 times |
Fri 21 November 2025 |
59.33 (3.38%) |
57.92 |
57.92 - 59.69 |
0.9058 times |
Thu 20 November 2025 |
57.39 (-0.28%) |
58.00 |
57.39 - 58.07 |
0.2536 times |
Wed 19 November 2025 |
57.55 (1.18%) |
57.14 |
57.14 - 57.55 |
0.2536 times |
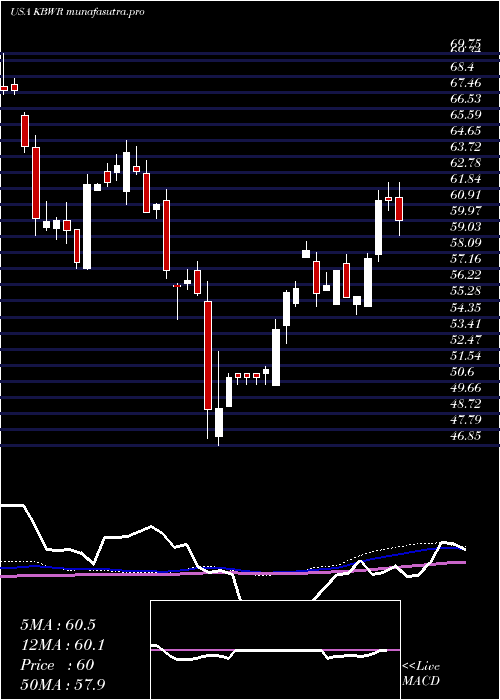
Weekly price and charts InvescoKbw Strong weekly Stock price targets for InvescoKbw KBWR are 60.95 and 63.18 | Weekly Target 1 | 59.09 | | Weekly Target 2 | 60.57 | | Weekly Target 3 | 61.316666666667 | | Weekly Target 4 | 62.8 | | Weekly Target 5 | 63.55 |
Weekly price and volumes for Invesco Kbw
| Date |
Closing |
Open |
Range |
Volume |
Thu 04 December 2025 |
62.06 (2.49%) |
59.83 |
59.83 - 62.06 |
0.9399 times |
Fri 28 November 2025 |
60.55 (2.06%) |
59.02 |
59.02 - 61.31 |
0.7845 times |
Fri 21 November 2025 |
59.33 (1.3%) |
57.87 |
56.00 - 59.69 |
0.5724 times |
Fri 14 November 2025 |
58.57 (-0.09%) |
59.09 |
57.91 - 59.30 |
0.6219 times |
Fri 07 November 2025 |
58.62 (1.84%) |
57.35 |
57.35 - 58.62 |
0.5936 times |
Fri 31 October 2025 |
57.56 (0%) |
57.51 |
57.51 - 57.56 |
0.0495 times |
Fri 31 October 2025 |
57.56 (-1.81%) |
58.46 |
57.21 - 58.84 |
0.7279 times |
Fri 24 October 2025 |
58.62 (2.66%) |
57.40 |
57.40 - 58.79 |
0.9823 times |
Fri 17 October 2025 |
57.10 (-1.67%) |
59.30 |
55.60 - 61.42 |
2.9117 times |
Fri 10 October 2025 |
58.07 (-4.76%) |
61.45 |
57.92 - 62.27 |
1.8163 times |
Fri 03 October 2025 |
60.97 (-0.85%) |
60.99 |
59.83 - 60.99 |
0.3937 times |
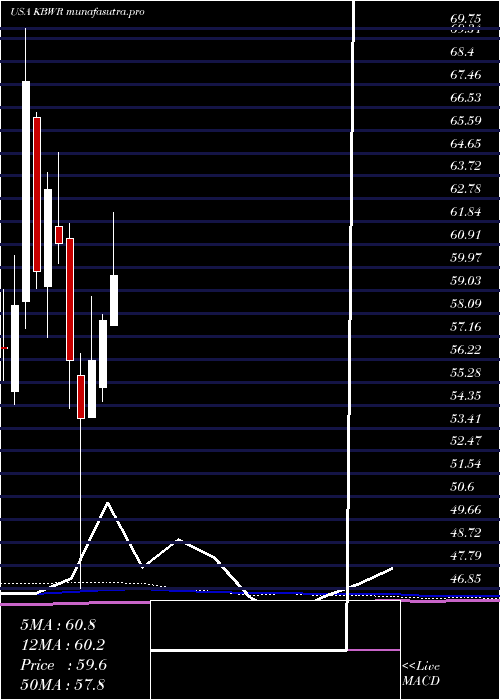
Monthly price and charts InvescoKbw Strong monthly Stock price targets for InvescoKbw KBWR are 60.95 and 63.18 | Monthly Target 1 | 59.09 | | Monthly Target 2 | 60.57 | | Monthly Target 3 | 61.316666666667 | | Monthly Target 4 | 62.8 | | Monthly Target 5 | 63.55 |
Monthly price and volumes Invesco Kbw
| Date |
Closing |
Open |
Range |
Volume |
Thu 04 December 2025 |
62.06 (2.49%) |
59.83 |
59.83 - 62.06 |
0.2176 times |
Fri 28 November 2025 |
60.55 (5.19%) |
57.35 |
56.00 - 61.31 |
0.5956 times |
Fri 31 October 2025 |
57.56 (-5.16%) |
60.31 |
55.60 - 62.27 |
1.5719 times |
Tue 30 September 2025 |
60.69 (-3.57%) |
62.31 |
60.16 - 64.41 |
0.9555 times |
Fri 29 August 2025 |
62.94 (9.02%) |
56.03 |
55.86 - 63.50 |
0.8197 times |
Thu 31 July 2025 |
57.73 (-0.1%) |
57.59 |
57.59 - 62.23 |
1.487 times |
Mon 30 June 2025 |
57.79 (2.87%) |
55.08 |
54.50 - 58.05 |
1.021 times |
Fri 30 May 2025 |
56.18 (4.42%) |
53.84 |
53.84 - 58.78 |
0.6823 times |
Wed 30 April 2025 |
53.80 (-4.2%) |
55.54 |
46.85 - 56.44 |
1.9291 times |
Mon 31 March 2025 |
56.16 (-7.84%) |
61.17 |
54.20 - 61.77 |
0.7204 times |
Fri 28 February 2025 |
60.94 (-3.55%) |
61.65 |
60.12 - 64.66 |
0.5023 times |
DMA SMA EMA moving averages of Invesco Kbw KBWR
DMA (daily moving average) of Invesco Kbw KBWR
| DMA period | DMA value | | 5 day DMA | 61.32 | | 12 day DMA | 59.93 | | 20 day DMA | 59.3 | | 35 day DMA | 58.65 | | 50 day DMA | 59.24 | | 100 day DMA | 60.02 | | 150 day DMA | 59.17 | | 200 day DMA | 58.1 | EMA (exponential moving average) of Invesco Kbw KBWR
| EMA period | EMA current | EMA prev | EMA prev2 | | 5 day EMA | 61.39 | 61.05 | 60.59 | | 12 day EMA | 60.39 | 60.09 | 59.75 | | 20 day EMA | 59.83 | 59.59 | 59.34 | | 35 day EMA | 59.67 | 59.53 | 59.39 | | 50 day EMA | 59.68 | 59.58 | 59.48 |
SMA (simple moving average) of Invesco Kbw KBWR
| SMA period | SMA current | SMA prev | SMA prev2 | | 5 day SMA | 61.32 | 61.08 | 60.92 | | 12 day SMA | 59.93 | 59.44 | 59.16 | | 20 day SMA | 59.3 | 59.11 | 58.89 | | 35 day SMA | 58.65 | 58.58 | 58.56 | | 50 day SMA | 59.24 | 59.22 | 59.21 | | 100 day SMA | 60.02 | 60 | 60 | | 150 day SMA | 59.17 | 59.11 | 59.06 | | 200 day SMA | 58.1 | 58.11 | 58.11 |
|
|
