InvescoKbw KBWB full analysis,charts,indicators,moving averages,SMA,DMA,EMA,ADX,MACD,RSIInvesco Kbw KBWB WideScreen charts, DMA,SMA,EMA technical analysis, forecast prediction, by indicators ADX,MACD,RSI,CCI USA stock exchange
operates under N A sector & deals in N A
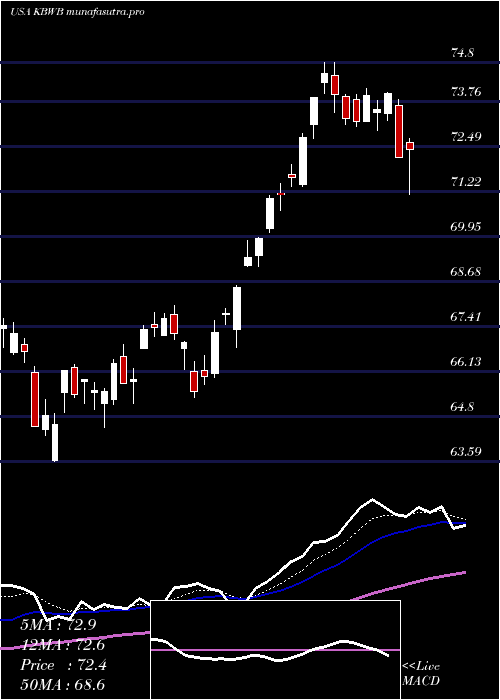
Daily price and charts and targets InvescoKbw Strong Daily Stock price targets for InvescoKbw KBWB are 75.21 and 76.72 | Daily Target 1 | 73.98 | | Daily Target 2 | 74.93 | | Daily Target 3 | 75.493333333333 | | Daily Target 4 | 76.44 | | Daily Target 5 | 77 |
Daily price and volume Invesco Kbw
| Date |
Closing |
Open |
Range |
Volume |
Mon 20 October 2025 |
75.87 (2.2%) |
74.66 |
74.55 - 76.06 |
0.9016 times |
Fri 17 October 2025 |
74.24 (0.53%) |
74.22 |
73.39 - 74.53 |
0.9694 times |
Thu 16 October 2025 |
73.85 (-3.65%) |
76.65 |
73.32 - 76.91 |
1.9324 times |
Wed 15 October 2025 |
76.65 (0.38%) |
77.41 |
76.18 - 77.75 |
0.8935 times |
Tue 14 October 2025 |
76.36 (1.85%) |
74.80 |
74.04 - 77.07 |
1.4742 times |
Mon 13 October 2025 |
74.97 (1.93%) |
74.57 |
74.37 - 75.21 |
1.0602 times |
Fri 10 October 2025 |
73.55 (-3.43%) |
76.45 |
73.52 - 76.68 |
0.8339 times |
Thu 09 October 2025 |
76.16 (0.08%) |
76.11 |
75.76 - 76.77 |
0.6165 times |
Wed 08 October 2025 |
76.10 (-1.17%) |
77.31 |
76.01 - 77.31 |
0.5628 times |
Tue 07 October 2025 |
77.00 (-0.43%) |
77.50 |
76.67 - 77.85 |
0.7554 times |
Mon 06 October 2025 |
77.33 (-0.09%) |
77.78 |
76.53 - 78.72 |
0.8082 times |
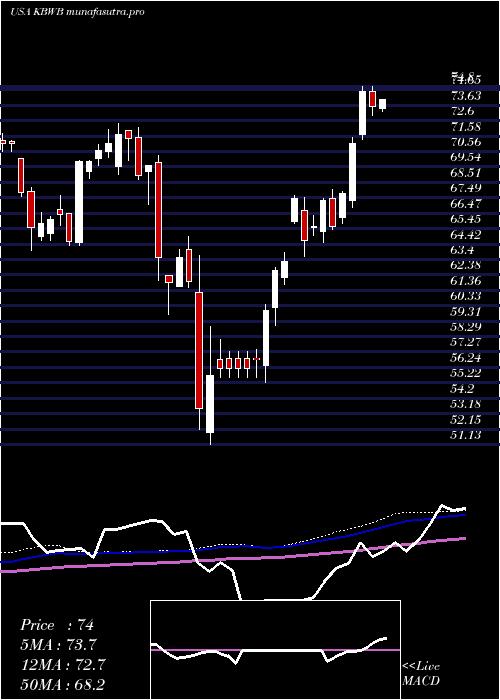
Weekly price and charts InvescoKbw Strong weekly Stock price targets for InvescoKbw KBWB are 75.21 and 76.72 | Weekly Target 1 | 73.98 | | Weekly Target 2 | 74.93 | | Weekly Target 3 | 75.493333333333 | | Weekly Target 4 | 76.44 | | Weekly Target 5 | 77 |
Weekly price and volumes for Invesco Kbw
| Date |
Closing |
Open |
Range |
Volume |
Mon 20 October 2025 |
75.87 (2.2%) |
74.66 |
74.55 - 76.06 |
0.3052 times |
Fri 17 October 2025 |
74.24 (0.94%) |
74.57 |
73.32 - 77.75 |
2.143 times |
Fri 10 October 2025 |
73.55 (-4.97%) |
77.78 |
73.52 - 78.72 |
1.211 times |
Fri 03 October 2025 |
77.40 (-2.06%) |
79.43 |
76.34 - 79.44 |
1.17 times |
Fri 26 September 2025 |
79.03 (-0.89%) |
78.67 |
77.70 - 80.04 |
0.9987 times |
Fri 19 September 2025 |
79.74 (2.15%) |
78.35 |
76.95 - 79.99 |
1.4224 times |
Fri 12 September 2025 |
78.06 (1.97%) |
76.58 |
75.83 - 78.25 |
0.8855 times |
Fri 05 September 2025 |
76.55 (-1.44%) |
76.88 |
75.92 - 78.43 |
0.6818 times |
Fri 29 August 2025 |
77.67 (0%) |
77.66 |
77.23 - 77.94 |
0.1333 times |
Fri 29 August 2025 |
77.67 (1.93%) |
76.09 |
75.78 - 77.94 |
1.0491 times |
Fri 22 August 2025 |
76.20 (3.55%) |
73.41 |
72.96 - 76.34 |
1.1696 times |
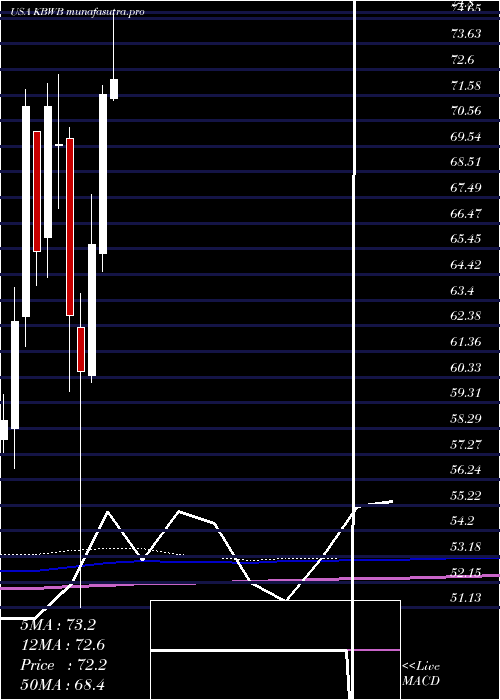
Monthly price and charts InvescoKbw Strong monthly Stock price targets for InvescoKbw KBWB are 71.9 and 77.3 | Monthly Target 1 | 70.57 | | Monthly Target 2 | 73.22 | | Monthly Target 3 | 75.97 | | Monthly Target 4 | 78.62 | | Monthly Target 5 | 81.37 |
Monthly price and volumes Invesco Kbw
| Date |
Closing |
Open |
Range |
Volume |
Mon 20 October 2025 |
75.87 (-2.99%) |
77.80 |
73.32 - 78.72 |
1.0351 times |
Tue 30 September 2025 |
78.21 (0.7%) |
76.88 |
75.83 - 80.04 |
1.1112 times |
Fri 29 August 2025 |
77.67 (5.64%) |
72.09 |
70.68 - 77.94 |
1.0287 times |
Thu 31 July 2025 |
73.52 (2.65%) |
71.43 |
71.14 - 75.35 |
1.1409 times |
Mon 30 June 2025 |
71.62 (9.16%) |
65.24 |
64.54 - 71.98 |
0.8268 times |
Fri 30 May 2025 |
65.61 (8.37%) |
60.41 |
60.12 - 67.62 |
0.6166 times |
Wed 30 April 2025 |
60.54 (-3.55%) |
62.32 |
51.13 - 63.67 |
1.3419 times |
Mon 31 March 2025 |
62.77 (-9.81%) |
69.86 |
59.75 - 70.29 |
1.0857 times |
Fri 28 February 2025 |
69.60 (-2.11%) |
69.56 |
67.05 - 72.39 |
0.849 times |
Fri 31 January 2025 |
71.10 (8.8%) |
65.89 |
64.30 - 72.03 |
0.9641 times |
Tue 31 December 2024 |
65.35 (-8.09%) |
70.11 |
64.00 - 70.11 |
0.6195 times |
DMA SMA EMA moving averages of Invesco Kbw KBWB
DMA (daily moving average) of Invesco Kbw KBWB
| DMA period | DMA value | | 5 day DMA | 75.39 | | 12 day DMA | 75.79 | | 20 day DMA | 76.75 | | 35 day DMA | 77.21 | | 50 day DMA | 76.7 | | 100 day DMA | 73.77 | | 150 day DMA | 69.52 | | 200 day DMA | 69.18 | EMA (exponential moving average) of Invesco Kbw KBWB
| EMA period | EMA current | EMA prev | EMA prev2 | | 5 day EMA | 75.26 | 74.95 | 75.31 | | 12 day EMA | 75.79 | 75.78 | 76.06 | | 20 day EMA | 76.22 | 76.26 | 76.47 | | 35 day EMA | 76.23 | 76.25 | 76.37 | | 50 day EMA | 76.21 | 76.22 | 76.3 |
SMA (simple moving average) of Invesco Kbw KBWB
| SMA period | SMA current | SMA prev | SMA prev2 | | 5 day SMA | 75.39 | 75.21 | 75.08 | | 12 day SMA | 75.79 | 75.87 | 76.11 | | 20 day SMA | 76.75 | 76.89 | 77.17 | | 35 day SMA | 77.21 | 77.26 | 77.36 | | 50 day SMA | 76.7 | 76.63 | 76.59 | | 100 day SMA | 73.77 | 73.68 | 73.58 | | 150 day SMA | 69.52 | 69.42 | 69.33 | | 200 day SMA | 69.18 | 69.13 | 69.08 |
|
|
