KbFinancial KB full analysis,charts,indicators,moving averages,SMA,DMA,EMA,ADX,MACD,RSIKb Financial KB WideScreen charts, DMA,SMA,EMA technical analysis, forecast prediction, by indicators ADX,MACD,RSI,CCI USA stock exchange
operates under Finance sector & deals in Commercial Banks
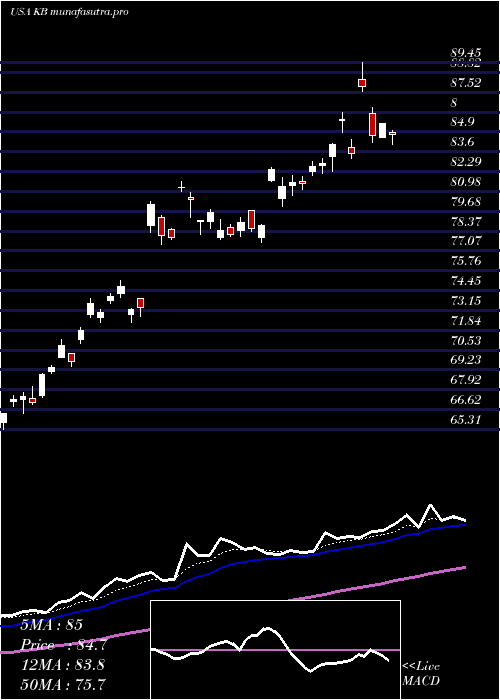
Daily price and charts and targets KbFinancial Strong Daily Stock price targets for KbFinancial KB are 80.1 and 81.75 | Daily Target 1 | 79.76 | | Daily Target 2 | 80.43 | | Daily Target 3 | 81.41 | | Daily Target 4 | 82.08 | | Daily Target 5 | 83.06 |
Daily price and volume Kb Financial
| Date |
Closing |
Open |
Range |
Volume |
Tue 21 October 2025 |
81.10 (-2.04%) |
82.38 |
80.74 - 82.39 |
0.9437 times |
Mon 20 October 2025 |
82.79 (2.26%) |
82.26 |
82.26 - 83.30 |
1.0281 times |
Fri 17 October 2025 |
80.96 (0.9%) |
80.19 |
79.72 - 81.08 |
0.7536 times |
Thu 16 October 2025 |
80.24 (-1.32%) |
81.09 |
79.97 - 81.09 |
1.5499 times |
Wed 15 October 2025 |
81.31 (3.2%) |
81.18 |
81.10 - 81.69 |
0.8254 times |
Tue 14 October 2025 |
78.79 (-0.32%) |
77.59 |
77.44 - 79.24 |
1.2676 times |
Mon 13 October 2025 |
79.04 (-3.27%) |
78.66 |
78.25 - 79.21 |
1.1939 times |
Tue 07 October 2025 |
81.71 (-1.8%) |
82.74 |
81.71 - 83.03 |
1.1105 times |
Mon 06 October 2025 |
83.21 (0.46%) |
83.20 |
82.89 - 83.63 |
0.496 times |
Fri 03 October 2025 |
82.83 (0.67%) |
82.30 |
82.30 - 83.45 |
0.8312 times |
Thu 02 October 2025 |
82.28 (-1.51%) |
83.54 |
81.97 - 83.63 |
0.4842 times |
Weekly price and charts KbFinancial Strong weekly Stock price targets for KbFinancial KB are 79.64 and 82.2 | Weekly Target 1 | 79.15 | | Weekly Target 2 | 80.13 | | Weekly Target 3 | 81.713333333333 | | Weekly Target 4 | 82.69 | | Weekly Target 5 | 84.27 |
Weekly price and volumes for Kb Financial
| Date |
Closing |
Open |
Range |
Volume |
Tue 21 October 2025 |
81.10 (0.17%) |
82.26 |
80.74 - 83.30 |
0.4244 times |
Fri 17 October 2025 |
80.96 (-0.92%) |
78.66 |
77.44 - 81.69 |
1.2034 times |
Tue 07 October 2025 |
81.71 (-1.35%) |
83.20 |
81.71 - 83.63 |
0.3458 times |
Fri 03 October 2025 |
82.83 (2.46%) |
83.11 |
81.97 - 83.63 |
0.9452 times |
Fri 26 September 2025 |
80.84 (-3.56%) |
83.97 |
80.22 - 84.73 |
1.8911 times |
Fri 19 September 2025 |
83.82 (-1.84%) |
86.35 |
82.78 - 86.50 |
1.3255 times |
Fri 12 September 2025 |
85.39 (9.29%) |
77.00 |
76.31 - 85.45 |
1.5917 times |
Fri 05 September 2025 |
78.13 (-0.67%) |
78.00 |
77.53 - 79.73 |
0.905 times |
Fri 29 August 2025 |
78.66 (0%) |
78.10 |
77.85 - 78.67 |
0.1935 times |
Fri 29 August 2025 |
78.66 (-1.47%) |
79.38 |
77.28 - 79.57 |
1.1744 times |
Fri 22 August 2025 |
79.83 (-2.5%) |
78.37 |
77.57 - 80.25 |
1.5813 times |
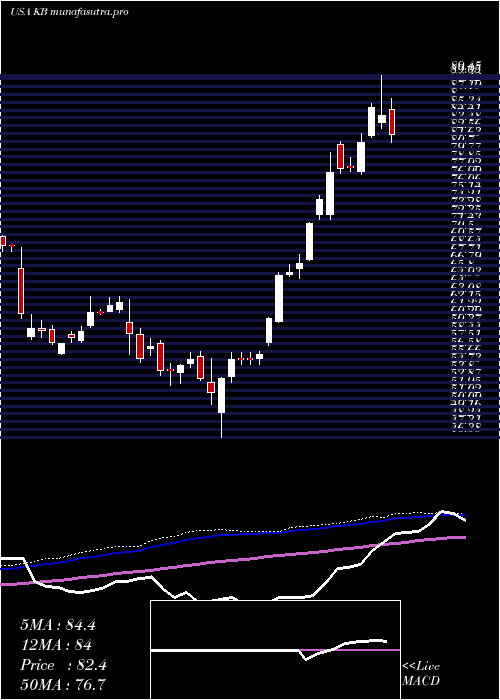
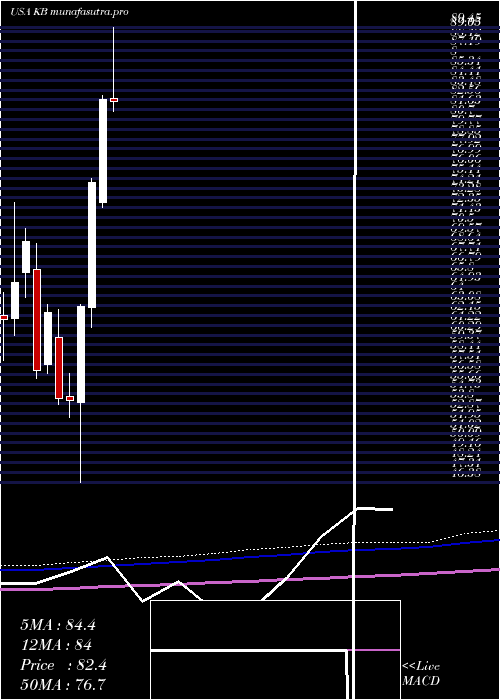
Monthly price and charts KbFinancial Strong monthly Stock price targets for KbFinancial KB are 76.18 and 82.37 | Monthly Target 1 | 74.53 | | Monthly Target 2 | 77.82 | | Monthly Target 3 | 80.723333333333 | | Monthly Target 4 | 84.01 | | Monthly Target 5 | 86.91 |
Monthly price and volumes Kb Financial
| Date |
Closing |
Open |
Range |
Volume |
Tue 21 October 2025 |
81.10 (-2.18%) |
83.28 |
77.44 - 83.63 |
0.3378 times |
Tue 30 September 2025 |
82.91 (5.4%) |
78.00 |
76.31 - 86.50 |
0.8254 times |
Fri 29 August 2025 |
78.66 (-0.62%) |
76.85 |
76.41 - 83.87 |
0.8789 times |
Thu 31 July 2025 |
79.15 (-4.17%) |
82.71 |
78.18 - 92.39 |
1.7387 times |
Mon 30 June 2025 |
82.59 (10.49%) |
72.88 |
72.36 - 82.98 |
1.2225 times |
Fri 30 May 2025 |
74.75 (18.69%) |
62.86 |
61.02 - 75.14 |
1.0824 times |
Wed 30 April 2025 |
62.98 (16.39%) |
53.93 |
46.38 - 63.20 |
1.0904 times |
Mon 31 March 2025 |
54.11 (-0.39%) |
54.46 |
52.54 - 56.65 |
1.0068 times |
Fri 28 February 2025 |
54.32 (-13.05%) |
60.10 |
53.71 - 62.74 |
0.9599 times |
Fri 31 January 2025 |
62.47 (9.79%) |
57.55 |
56.62 - 63.16 |
0.8572 times |
Tue 31 December 2024 |
56.90 (-17.75%) |
66.50 |
56.21 - 68.99 |
0.9957 times |
DMA SMA EMA moving averages of Kb Financial KB
DMA (daily moving average) of Kb Financial KB
| DMA period | DMA value | | 5 day DMA | 81.28 | | 12 day DMA | 81.48 | | 20 day DMA | 81.87 | | 35 day DMA | 81.73 | | 50 day DMA | 81.23 | | 100 day DMA | 80.99 | | 150 day DMA | 73.69 | | 200 day DMA | 69.88 | EMA (exponential moving average) of Kb Financial KB
| EMA period | EMA current | EMA prev | EMA prev2 | | 5 day EMA | 81.3 | 81.4 | 80.71 | | 12 day EMA | 81.44 | 81.5 | 81.26 | | 20 day EMA | 81.61 | 81.66 | 81.54 | | 35 day EMA | 81.37 | 81.39 | 81.31 | | 50 day EMA | 81.2 | 81.2 | 81.13 |
SMA (simple moving average) of Kb Financial KB
| SMA period | SMA current | SMA prev | SMA prev2 | | 5 day SMA | 81.28 | 80.82 | 80.07 | | 12 day SMA | 81.48 | 81.63 | 81.63 | | 20 day SMA | 81.87 | 82.03 | 82.17 | | 35 day SMA | 81.73 | 81.68 | 81.55 | | 50 day SMA | 81.23 | 81.26 | 81.27 | | 100 day SMA | 80.99 | 80.88 | 80.76 | | 150 day SMA | 73.69 | 73.51 | 73.31 | | 200 day SMA | 69.88 | 69.76 | 69.64 |
|
|
