NavientCorporation JSM full analysis,charts,indicators,moving averages,SMA,DMA,EMA,ADX,MACD,RSINavient Corporation JSM WideScreen charts, DMA,SMA,EMA technical analysis, forecast prediction, by indicators ADX,MACD,RSI,CCI USA stock exchange
operates under Finance sector & deals in Finance Consumer Services
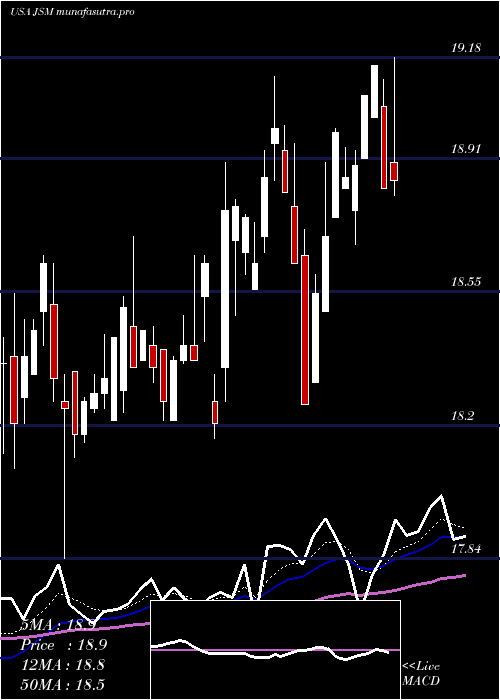
Daily price and charts and targets NavientCorporation Strong Daily Stock price targets for NavientCorporation JSM are 19.65 and 19.73 | Daily Target 1 | 19.64 | | Daily Target 2 | 19.66 | | Daily Target 3 | 19.716666666667 | | Daily Target 4 | 19.74 | | Daily Target 5 | 19.8 |
Daily price and volume Navient Corporation
| Date |
Closing |
Open |
Range |
Volume |
Thu 04 December 2025 |
19.69 (-0.15%) |
19.74 |
19.69 - 19.77 |
0.2661 times |
Wed 03 December 2025 |
19.72 (0%) |
19.75 |
19.63 - 19.77 |
0.4964 times |
Tue 02 December 2025 |
19.72 (-0.2%) |
19.74 |
19.61 - 19.78 |
0.7728 times |
Mon 01 December 2025 |
19.76 (-0.1%) |
19.67 |
19.62 - 19.76 |
0.3787 times |
Fri 28 November 2025 |
19.78 (0.82%) |
19.61 |
19.56 - 19.79 |
0.9928 times |
Wed 26 November 2025 |
19.62 (1.03%) |
19.31 |
19.31 - 19.63 |
4.4063 times |
Tue 25 November 2025 |
19.42 (0.73%) |
19.21 |
19.21 - 19.44 |
1.0389 times |
Mon 24 November 2025 |
19.28 (-0.62%) |
19.32 |
19.18 - 19.40 |
0.7062 times |
Fri 21 November 2025 |
19.40 (0.52%) |
19.15 |
19.15 - 19.46 |
0.3838 times |
Thu 20 November 2025 |
19.30 (-0.46%) |
19.39 |
19.20 - 19.41 |
0.5578 times |
Wed 19 November 2025 |
19.39 (0.15%) |
19.37 |
19.19 - 19.43 |
0.3173 times |
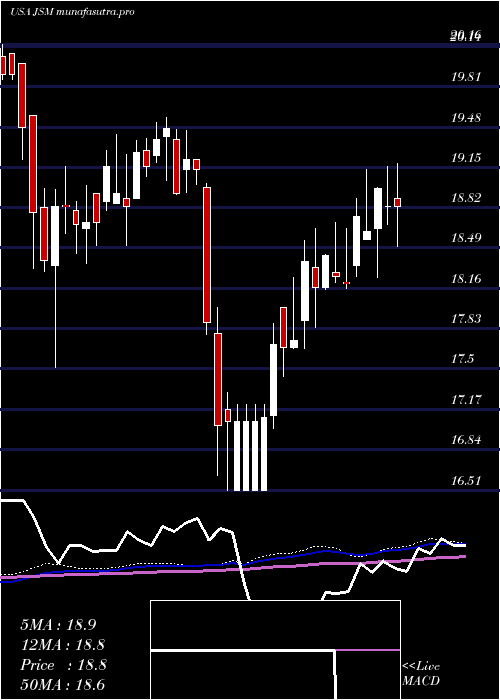
Weekly price and charts NavientCorporation Strong weekly Stock price targets for NavientCorporation JSM are 19.65 and 19.82 | Weekly Target 1 | 19.52 | | Weekly Target 2 | 19.61 | | Weekly Target 3 | 19.693333333333 | | Weekly Target 4 | 19.78 | | Weekly Target 5 | 19.86 |
Weekly price and volumes for Navient Corporation
| Date |
Closing |
Open |
Range |
Volume |
Thu 04 December 2025 |
19.69 (-0.46%) |
19.67 |
19.61 - 19.78 |
0.5031 times |
Fri 28 November 2025 |
19.78 (1.96%) |
19.32 |
19.18 - 19.79 |
1.8779 times |
Fri 21 November 2025 |
19.40 (1.73%) |
19.15 |
19.06 - 19.46 |
0.7291 times |
Fri 14 November 2025 |
19.07 (-0.1%) |
19.19 |
18.93 - 19.54 |
0.7883 times |
Fri 07 November 2025 |
19.09 (0.63%) |
18.74 |
18.60 - 19.21 |
0.9631 times |
Fri 31 October 2025 |
18.97 (0%) |
19.26 |
18.84 - 19.28 |
0.9188 times |
Fri 31 October 2025 |
18.97 (-3.61%) |
19.59 |
18.84 - 19.63 |
1.551 times |
Fri 24 October 2025 |
19.68 (1.29%) |
19.53 |
19.40 - 19.95 |
0.5461 times |
Fri 17 October 2025 |
19.43 (-2.21%) |
19.89 |
19.40 - 20.16 |
1.0842 times |
Fri 10 October 2025 |
19.87 (-0.1%) |
19.92 |
19.75 - 19.99 |
1.0385 times |
Fri 03 October 2025 |
19.89 (1.17%) |
19.62 |
19.42 - 20.02 |
0.9597 times |
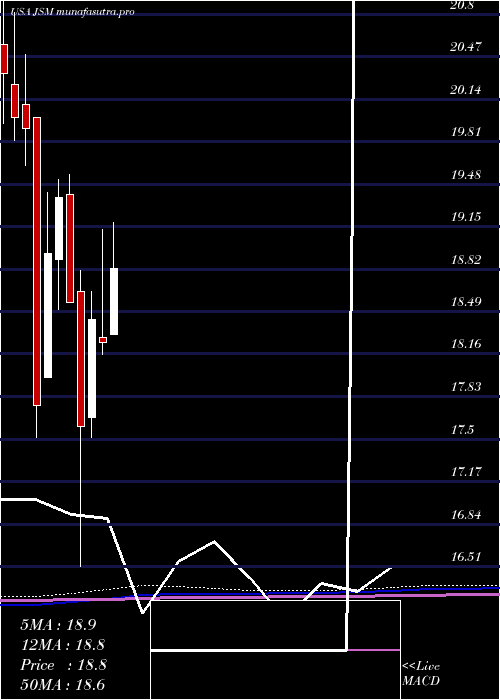
Monthly price and charts NavientCorporation Strong monthly Stock price targets for NavientCorporation JSM are 19.65 and 19.82 | Monthly Target 1 | 19.52 | | Monthly Target 2 | 19.61 | | Monthly Target 3 | 19.693333333333 | | Monthly Target 4 | 19.78 | | Monthly Target 5 | 19.86 |
Monthly price and volumes Navient Corporation
| Date |
Closing |
Open |
Range |
Volume |
Thu 04 December 2025 |
19.69 (-0.46%) |
19.67 |
19.61 - 19.78 |
0.1239 times |
Fri 28 November 2025 |
19.78 (4.27%) |
18.74 |
18.60 - 19.79 |
1.0735 times |
Fri 31 October 2025 |
18.97 (-5.15%) |
20.00 |
18.84 - 20.16 |
1.3874 times |
Tue 30 September 2025 |
20.00 (5.93%) |
19.15 |
18.90 - 20.00 |
1.2127 times |
Fri 29 August 2025 |
18.88 (-0.68%) |
18.92 |
18.88 - 19.51 |
0.7372 times |
Thu 31 July 2025 |
19.01 (4.16%) |
18.31 |
18.30 - 19.18 |
1.0584 times |
Mon 30 June 2025 |
18.25 (-0.98%) |
18.29 |
18.16 - 19.13 |
1.1381 times |
Fri 30 May 2025 |
18.43 (4.72%) |
17.67 |
17.51 - 18.65 |
1.0785 times |
Wed 30 April 2025 |
17.60 (-5.17%) |
18.65 |
16.51 - 18.81 |
1.2994 times |
Mon 31 March 2025 |
18.56 (-4.23%) |
19.40 |
18.56 - 19.56 |
0.8908 times |
Fri 28 February 2025 |
19.38 (2.32%) |
18.90 |
18.51 - 19.52 |
0.7528 times |
DMA SMA EMA moving averages of Navient Corporation JSM
DMA (daily moving average) of Navient Corporation JSM
| DMA period | DMA value | | 5 day DMA | 19.73 | | 12 day DMA | 19.54 | | 20 day DMA | 19.41 | | 35 day DMA | 19.39 | | 50 day DMA | 19.54 | | 100 day DMA | 19.38 | | 150 day DMA | 19.06 | | 200 day DMA | 18.89 | EMA (exponential moving average) of Navient Corporation JSM
| EMA period | EMA current | EMA prev | EMA prev2 | | 5 day EMA | 19.68 | 19.67 | 19.65 | | 12 day EMA | 19.56 | 19.54 | 19.51 | | 20 day EMA | 19.5 | 19.48 | 19.46 | | 35 day EMA | 19.53 | 19.52 | 19.51 | | 50 day EMA | 19.57 | 19.57 | 19.56 |
SMA (simple moving average) of Navient Corporation JSM
| SMA period | SMA current | SMA prev | SMA prev2 | | 5 day SMA | 19.73 | 19.72 | 19.66 | | 12 day SMA | 19.54 | 19.5 | 19.44 | | 20 day SMA | 19.41 | 19.36 | 19.3 | | 35 day SMA | 19.39 | 19.4 | 19.4 | | 50 day SMA | 19.54 | 19.54 | 19.53 | | 100 day SMA | 19.38 | 19.37 | 19.36 | | 150 day SMA | 19.06 | 19.05 | 19.03 | | 200 day SMA | 18.89 | 18.89 | 18.89 |
|
|
