NuveenReal JRS full analysis,charts,indicators,moving averages,SMA,DMA,EMA,ADX,MACD,RSINuveen Real JRS WideScreen charts, DMA,SMA,EMA technical analysis, forecast prediction, by indicators ADX,MACD,RSI,CCI USA stock exchange
operates under N A sector & deals in N A
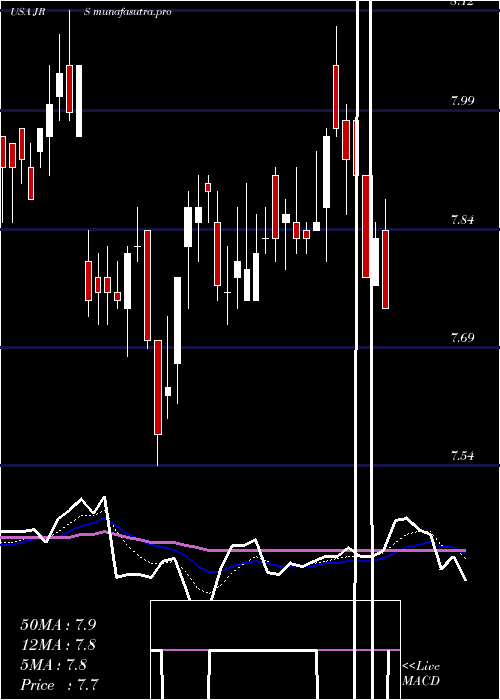
Daily price and charts and targets NuveenReal Strong Daily Stock price targets for NuveenReal JRS are 7.71 and 7.84 | Daily Target 1 | 7.69 | | Daily Target 2 | 7.73 | | Daily Target 3 | 7.8166666666667 | | Daily Target 4 | 7.86 | | Daily Target 5 | 7.95 |
Daily price and volume Nuveen Real
| Date |
Closing |
Open |
Range |
Volume |
Thu 04 December 2025 |
7.78 (-0.77%) |
7.80 |
7.77 - 7.90 |
0.8987 times |
Wed 03 December 2025 |
7.84 (0%) |
7.84 |
7.80 - 7.89 |
1.2464 times |
Tue 02 December 2025 |
7.84 (-0.51%) |
7.88 |
7.76 - 7.92 |
0.9018 times |
Mon 01 December 2025 |
7.88 (-1.01%) |
7.96 |
7.87 - 8.00 |
1.2859 times |
Fri 28 November 2025 |
7.96 (1.02%) |
7.89 |
7.73 - 7.97 |
0.7378 times |
Wed 26 November 2025 |
7.88 (1.16%) |
7.79 |
7.79 - 7.92 |
1.0414 times |
Tue 25 November 2025 |
7.79 (0.91%) |
7.75 |
7.74 - 7.87 |
1.0946 times |
Mon 24 November 2025 |
7.72 (0.26%) |
7.75 |
7.69 - 7.77 |
1.2889 times |
Fri 21 November 2025 |
7.70 (0.26%) |
7.64 |
7.62 - 7.76 |
0.7834 times |
Thu 20 November 2025 |
7.68 (0.13%) |
7.70 |
7.65 - 7.79 |
0.7211 times |
Wed 19 November 2025 |
7.67 (-1.67%) |
7.81 |
7.67 - 7.89 |
1.0794 times |
Weekly price and charts NuveenReal Strong weekly Stock price targets for NuveenReal JRS are 7.65 and 7.89 | Weekly Target 1 | 7.61 | | Weekly Target 2 | 7.69 | | Weekly Target 3 | 7.8466666666667 | | Weekly Target 4 | 7.93 | | Weekly Target 5 | 8.09 |
Weekly price and volumes for Nuveen Real
| Date |
Closing |
Open |
Range |
Volume |
Thu 04 December 2025 |
7.78 (-2.26%) |
7.96 |
7.76 - 8.00 |
0.9296 times |
Fri 28 November 2025 |
7.96 (3.38%) |
7.75 |
7.69 - 7.97 |
0.8931 times |
Fri 21 November 2025 |
7.70 (-2.53%) |
7.85 |
7.62 - 7.93 |
1.1599 times |
Fri 14 November 2025 |
7.90 (0.13%) |
7.91 |
7.89 - 8.12 |
1.2114 times |
Fri 07 November 2025 |
7.89 (-0.75%) |
7.90 |
7.85 - 8.02 |
0.8547 times |
Fri 31 October 2025 |
7.95 (0%) |
7.91 |
7.91 - 7.97 |
0.1394 times |
Fri 31 October 2025 |
7.95 (-2.69%) |
8.17 |
7.90 - 8.19 |
1.3635 times |
Fri 24 October 2025 |
8.17 (1.62%) |
8.04 |
8.04 - 8.21 |
0.8573 times |
Fri 17 October 2025 |
8.04 (-0.12%) |
7.97 |
7.93 - 8.17 |
1.7055 times |
Tue 07 October 2025 |
8.05 (-0.86%) |
8.12 |
8.00 - 8.36 |
0.8856 times |
Fri 03 October 2025 |
8.12 (0.5%) |
8.09 |
8.00 - 8.20 |
1.6743 times |

Monthly price and charts NuveenReal Strong monthly Stock price targets for NuveenReal JRS are 7.65 and 7.89 | Monthly Target 1 | 7.61 | | Monthly Target 2 | 7.69 | | Monthly Target 3 | 7.8466666666667 | | Monthly Target 4 | 7.93 | | Monthly Target 5 | 8.09 |
Monthly price and volumes Nuveen Real
| Date |
Closing |
Open |
Range |
Volume |
Thu 04 December 2025 |
7.78 (-2.26%) |
7.96 |
7.76 - 8.00 |
0.1822 times |
Fri 28 November 2025 |
7.96 (0.13%) |
7.90 |
7.62 - 8.12 |
0.8075 times |
Fri 31 October 2025 |
7.95 (-2.81%) |
8.20 |
7.90 - 8.36 |
1.2052 times |
Tue 30 September 2025 |
8.18 (0.74%) |
8.04 |
7.96 - 8.38 |
1.1416 times |
Fri 29 August 2025 |
8.12 (6.01%) |
7.67 |
7.53 - 8.12 |
1.0935 times |
Thu 31 July 2025 |
7.66 (-1.54%) |
7.82 |
7.64 - 8.10 |
1.3027 times |
Mon 30 June 2025 |
7.78 (-2.38%) |
7.96 |
7.54 - 8.12 |
0.9387 times |
Fri 30 May 2025 |
7.97 (1.92%) |
7.90 |
7.58 - 8.12 |
1.0599 times |
Wed 30 April 2025 |
7.82 (-5.1%) |
8.29 |
6.56 - 8.32 |
1.4269 times |
Mon 31 March 2025 |
8.24 (-6.89%) |
8.90 |
8.04 - 8.92 |
0.8419 times |
Fri 28 February 2025 |
8.85 (1.72%) |
8.60 |
8.40 - 8.85 |
0.945 times |

DMA SMA EMA moving averages of Nuveen Real JRS
DMA (daily moving average) of Nuveen Real JRS
| DMA period | DMA value | | 5 day DMA | 7.86 | | 12 day DMA | 7.8 | | 20 day DMA | 7.85 | | 35 day DMA | 7.94 | | 50 day DMA | 7.98 | | 100 day DMA | 7.95 | | 150 day DMA | 7.92 | | 200 day DMA | 7.96 | EMA (exponential moving average) of Nuveen Real JRS
| EMA period | EMA current | EMA prev | EMA prev2 | | 5 day EMA | 7.83 | 7.85 | 7.85 | | 12 day EMA | 7.84 | 7.85 | 7.85 | | 20 day EMA | 7.87 | 7.88 | 7.88 | | 35 day EMA | 7.91 | 7.92 | 7.93 | | 50 day EMA | 7.97 | 7.98 | 7.99 |
SMA (simple moving average) of Nuveen Real JRS
| SMA period | SMA current | SMA prev | SMA prev2 | | 5 day SMA | 7.86 | 7.88 | 7.87 | | 12 day SMA | 7.8 | 7.8 | 7.8 | | 20 day SMA | 7.85 | 7.86 | 7.87 | | 35 day SMA | 7.94 | 7.95 | 7.95 | | 50 day SMA | 7.98 | 7.99 | 8 | | 100 day SMA | 7.95 | 7.95 | 7.95 | | 150 day SMA | 7.92 | 7.92 | 7.92 | | 200 day SMA | 7.96 | 7.97 | 7.97 |
|
|
