NuveenReal JRI full analysis,charts,indicators,moving averages,SMA,DMA,EMA,ADX,MACD,RSINuveen Real JRI WideScreen charts, DMA,SMA,EMA technical analysis, forecast prediction, by indicators ADX,MACD,RSI,CCI USA stock exchange
operates under N A sector & deals in N A
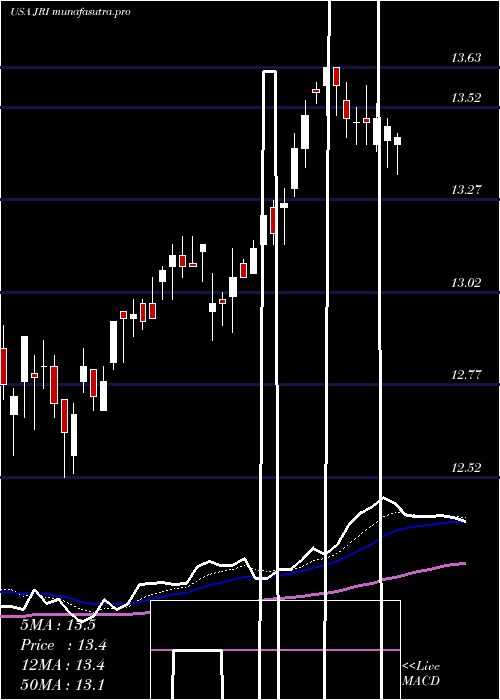
Daily price and charts and targets NuveenReal Strong Daily Stock price targets for NuveenReal JRI are 13.73 and 13.92 | Daily Target 1 | 13.59 | | Daily Target 2 | 13.67 | | Daily Target 3 | 13.78 | | Daily Target 4 | 13.86 | | Daily Target 5 | 13.97 |
Daily price and volume Nuveen Real
| Date |
Closing |
Open |
Range |
Volume |
Thu 04 December 2025 |
13.75 (0.36%) |
13.70 |
13.70 - 13.89 |
1.353 times |
Wed 03 December 2025 |
13.70 (-0.07%) |
13.74 |
13.70 - 13.80 |
1.0455 times |
Tue 02 December 2025 |
13.71 (-0.51%) |
13.82 |
13.66 - 13.92 |
0.9493 times |
Mon 01 December 2025 |
13.78 (-0.14%) |
13.80 |
13.73 - 13.83 |
1.4058 times |
Fri 28 November 2025 |
13.80 (1.17%) |
13.67 |
13.67 - 13.83 |
0.6571 times |
Wed 26 November 2025 |
13.64 (1.04%) |
13.46 |
13.46 - 13.64 |
0.5621 times |
Tue 25 November 2025 |
13.50 (0.82%) |
13.44 |
13.42 - 13.56 |
0.4483 times |
Mon 24 November 2025 |
13.39 (0.9%) |
13.37 |
13.27 - 13.48 |
1.563 times |
Fri 21 November 2025 |
13.27 (0.84%) |
13.16 |
13.13 - 13.35 |
0.8531 times |
Thu 20 November 2025 |
13.16 (-0.68%) |
13.39 |
13.08 - 13.39 |
1.1629 times |
Wed 19 November 2025 |
13.25 (-0.15%) |
13.33 |
13.23 - 13.36 |
0.9387 times |
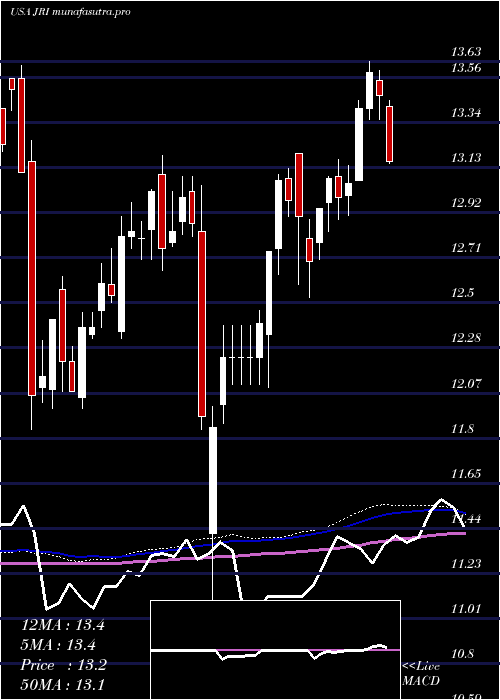
Weekly price and charts NuveenReal Strong weekly Stock price targets for NuveenReal JRI are 13.58 and 13.84 | Weekly Target 1 | 13.52 | | Weekly Target 2 | 13.63 | | Weekly Target 3 | 13.776666666667 | | Weekly Target 4 | 13.89 | | Weekly Target 5 | 14.04 |
Weekly price and volumes for Nuveen Real
| Date |
Closing |
Open |
Range |
Volume |
Thu 04 December 2025 |
13.75 (-0.36%) |
13.80 |
13.66 - 13.92 |
0.8988 times |
Fri 28 November 2025 |
13.80 (3.99%) |
13.37 |
13.27 - 13.83 |
0.6108 times |
Fri 21 November 2025 |
13.27 (-2.78%) |
13.64 |
13.08 - 13.64 |
1.2125 times |
Fri 14 November 2025 |
13.65 (-0.66%) |
13.72 |
13.53 - 13.92 |
0.9614 times |
Fri 07 November 2025 |
13.74 (-1.15%) |
13.83 |
13.65 - 13.85 |
0.8436 times |
Fri 31 October 2025 |
13.90 (0%) |
13.87 |
13.81 - 13.93 |
0.1617 times |
Fri 31 October 2025 |
13.90 (-1.21%) |
14.10 |
13.76 - 14.17 |
1.069 times |
Fri 24 October 2025 |
14.07 (2.18%) |
13.84 |
13.84 - 14.08 |
1.3352 times |
Fri 17 October 2025 |
13.77 (0%) |
13.93 |
13.72 - 14.13 |
1.2212 times |
Fri 10 October 2025 |
13.77 (-3.71%) |
14.25 |
13.75 - 14.30 |
1.6858 times |
Fri 03 October 2025 |
14.30 (2%) |
14.07 |
14.00 - 14.37 |
1.5153 times |
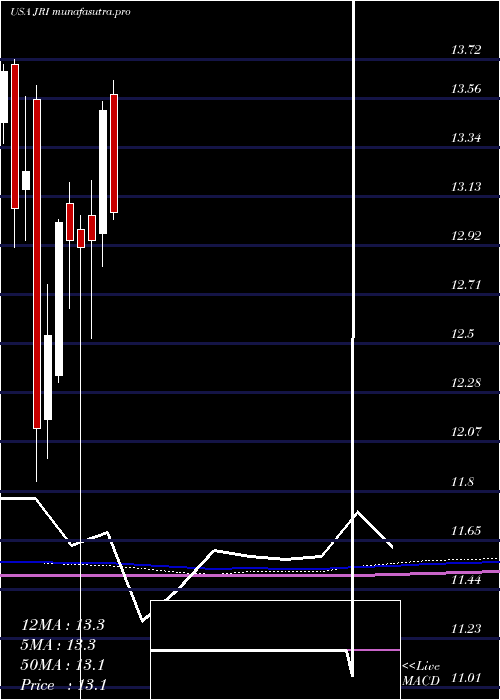
Monthly price and charts NuveenReal Strong monthly Stock price targets for NuveenReal JRI are 13.58 and 13.84 | Monthly Target 1 | 13.52 | | Monthly Target 2 | 13.63 | | Monthly Target 3 | 13.776666666667 | | Monthly Target 4 | 13.89 | | Monthly Target 5 | 14.04 |
Monthly price and volumes Nuveen Real
| Date |
Closing |
Open |
Range |
Volume |
Thu 04 December 2025 |
13.75 (-0.36%) |
13.80 |
13.66 - 13.92 |
0.1746 times |
Fri 28 November 2025 |
13.80 (-0.72%) |
13.83 |
13.08 - 13.92 |
0.7047 times |
Fri 31 October 2025 |
13.90 (-2.46%) |
14.27 |
13.72 - 14.37 |
1.2611 times |
Tue 30 September 2025 |
14.25 (4.78%) |
13.57 |
13.44 - 14.25 |
1.3609 times |
Fri 29 August 2025 |
13.60 (3.58%) |
13.15 |
13.05 - 13.60 |
0.7966 times |
Thu 31 July 2025 |
13.13 (-2.74%) |
13.57 |
13.00 - 13.63 |
1.3455 times |
Mon 30 June 2025 |
13.50 (4.33%) |
12.97 |
12.83 - 13.54 |
1.0016 times |
Fri 30 May 2025 |
12.94 (0.23%) |
13.05 |
12.52 - 13.20 |
1.0754 times |
Wed 30 April 2025 |
12.91 (-0.23%) |
12.99 |
10.59 - 13.05 |
1.3658 times |
Mon 31 March 2025 |
12.94 (-0.61%) |
13.10 |
12.65 - 13.19 |
0.9139 times |
Fri 28 February 2025 |
13.02 (3.91%) |
12.36 |
12.33 - 13.03 |
0.9248 times |
DMA SMA EMA moving averages of Nuveen Real JRI
DMA (daily moving average) of Nuveen Real JRI
| DMA period | DMA value | | 5 day DMA | 13.75 | | 12 day DMA | 13.52 | | 20 day DMA | 13.6 | | 35 day DMA | 13.73 | | 50 day DMA | 13.84 | | 100 day DMA | 13.66 | | 150 day DMA | 13.47 | | 200 day DMA | 13.26 | EMA (exponential moving average) of Nuveen Real JRI
| EMA period | EMA current | EMA prev | EMA prev2 | | 5 day EMA | 13.7 | 13.68 | 13.67 | | 12 day EMA | 13.64 | 13.62 | 13.61 | | 20 day EMA | 13.65 | 13.64 | 13.63 | | 35 day EMA | 13.72 | 13.72 | 13.72 | | 50 day EMA | 13.84 | 13.84 | 13.85 |
SMA (simple moving average) of Nuveen Real JRI
| SMA period | SMA current | SMA prev | SMA prev2 | | 5 day SMA | 13.75 | 13.73 | 13.69 | | 12 day SMA | 13.52 | 13.49 | 13.49 | | 20 day SMA | 13.6 | 13.6 | 13.6 | | 35 day SMA | 13.73 | 13.73 | 13.74 | | 50 day SMA | 13.84 | 13.84 | 13.85 | | 100 day SMA | 13.66 | 13.66 | 13.65 | | 150 day SMA | 13.47 | 13.46 | 13.46 | | 200 day SMA | 13.26 | 13.25 | 13.25 |
|
|
