StJoe JOE full analysis,charts,indicators,moving averages,SMA,DMA,EMA,ADX,MACD,RSISt Joe JOE WideScreen charts, DMA,SMA,EMA technical analysis, forecast prediction, by indicators ADX,MACD,RSI,CCI USA stock exchange
operates under Consumer Services sector & deals in Homebuilding
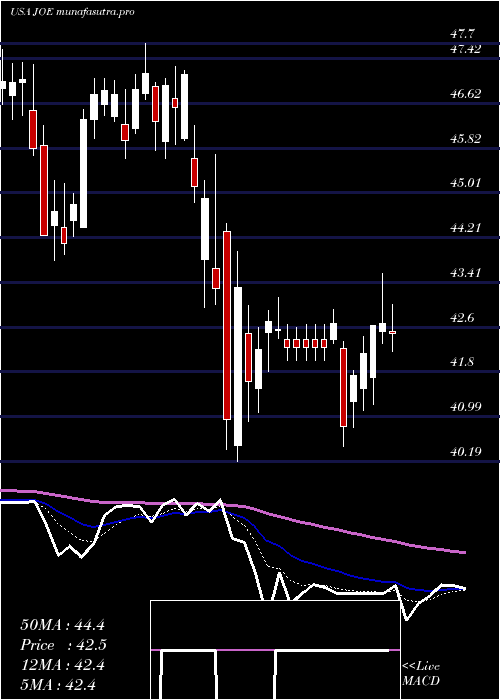
Daily price and charts and targets StJoe Strong Daily Stock price targets for StJoe JOE are 61.45 and 62.46 | Daily Target 1 | 60.66 | | Daily Target 2 | 61.22 | | Daily Target 3 | 61.666666666667 | | Daily Target 4 | 62.23 | | Daily Target 5 | 62.68 |
Daily price and volume St Joe
| Date |
Closing |
Open |
Range |
Volume |
Thu 04 December 2025 |
61.79 (-0.02%) |
61.46 |
61.10 - 62.11 |
0.8907 times |
Wed 03 December 2025 |
61.80 (0.73%) |
61.53 |
61.19 - 62.74 |
1.0512 times |
Tue 02 December 2025 |
61.35 (0.43%) |
61.26 |
58.62 - 61.59 |
1.3448 times |
Mon 01 December 2025 |
61.09 (1.26%) |
59.76 |
59.66 - 61.16 |
1.0682 times |
Fri 28 November 2025 |
60.33 (-0.69%) |
60.59 |
59.72 - 60.74 |
0.4291 times |
Wed 26 November 2025 |
60.75 (-0.38%) |
60.53 |
60.53 - 61.82 |
1.4758 times |
Tue 25 November 2025 |
60.98 (5.21%) |
58.52 |
58.52 - 61.62 |
1.2012 times |
Mon 24 November 2025 |
57.96 (1.05%) |
57.56 |
56.86 - 58.34 |
0.9982 times |
Fri 21 November 2025 |
57.36 (2.96%) |
56.17 |
56.00 - 57.63 |
0.8837 times |
Thu 20 November 2025 |
55.71 (-0.38%) |
56.20 |
55.61 - 57.28 |
0.6571 times |
Wed 19 November 2025 |
55.92 (-0.83%) |
56.28 |
55.85 - 56.76 |
0.6506 times |
Weekly price and charts StJoe Strong weekly Stock price targets for StJoe JOE are 60.21 and 64.33 | Weekly Target 1 | 56.93 | | Weekly Target 2 | 59.36 | | Weekly Target 3 | 61.05 | | Weekly Target 4 | 63.48 | | Weekly Target 5 | 65.17 |
Weekly price and volumes for St Joe
| Date |
Closing |
Open |
Range |
Volume |
Thu 04 December 2025 |
61.79 (2.42%) |
59.76 |
58.62 - 62.74 |
1.0681 times |
Fri 28 November 2025 |
60.33 (5.18%) |
57.56 |
56.86 - 61.82 |
1.0066 times |
Fri 21 November 2025 |
57.36 (0.33%) |
57.37 |
55.61 - 57.63 |
0.8864 times |
Fri 14 November 2025 |
57.17 (-2.31%) |
58.98 |
56.80 - 61.00 |
1.1766 times |
Fri 07 November 2025 |
58.52 (3.06%) |
58.76 |
58.02 - 59.70 |
1.2167 times |
Fri 31 October 2025 |
56.78 (0%) |
54.37 |
53.99 - 57.49 |
0.5045 times |
Fri 31 October 2025 |
56.78 (11.2%) |
51.32 |
48.82 - 57.49 |
1.9728 times |
Fri 24 October 2025 |
51.06 (6.09%) |
48.25 |
48.23 - 51.21 |
0.8166 times |
Fri 17 October 2025 |
48.13 (2.04%) |
47.15 |
46.61 - 49.16 |
1.0007 times |
Tue 07 October 2025 |
47.17 (-4.24%) |
49.17 |
47.03 - 49.38 |
0.351 times |
Fri 03 October 2025 |
49.26 (-0.16%) |
49.42 |
48.46 - 50.08 |
0.9947 times |
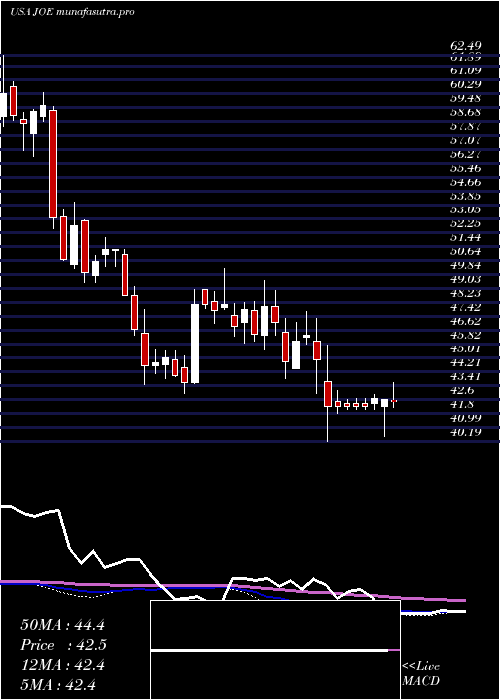
Monthly price and charts StJoe Strong monthly Stock price targets for StJoe JOE are 60.21 and 64.33 | Monthly Target 1 | 56.93 | | Monthly Target 2 | 59.36 | | Monthly Target 3 | 61.05 | | Monthly Target 4 | 63.48 | | Monthly Target 5 | 65.17 |
Monthly price and volumes St Joe
| Date |
Closing |
Open |
Range |
Volume |
Thu 04 December 2025 |
61.79 (2.42%) |
59.76 |
58.62 - 62.74 |
0.1943 times |
Fri 28 November 2025 |
60.33 (6.25%) |
58.76 |
55.61 - 61.82 |
0.7798 times |
Fri 31 October 2025 |
56.78 (14.75%) |
49.06 |
46.61 - 57.49 |
0.9521 times |
Tue 30 September 2025 |
49.48 (-1.94%) |
50.05 |
48.38 - 53.27 |
1.0386 times |
Fri 29 August 2025 |
50.46 (-0.08%) |
50.48 |
48.57 - 51.80 |
1.0588 times |
Thu 31 July 2025 |
50.50 (5.87%) |
47.56 |
47.54 - 52.45 |
1.1973 times |
Mon 30 June 2025 |
47.70 (6.69%) |
44.64 |
43.85 - 49.64 |
1.2302 times |
Fri 30 May 2025 |
44.71 (5.65%) |
42.48 |
41.92 - 46.85 |
1.0172 times |
Wed 30 April 2025 |
42.32 (-9.86%) |
46.72 |
40.19 - 47.28 |
1.2572 times |
Mon 31 March 2025 |
46.95 (-2.13%) |
48.00 |
43.80 - 48.92 |
1.2745 times |
Fri 28 February 2025 |
47.97 (-0.27%) |
47.47 |
45.51 - 49.47 |
0.8812 times |

DMA SMA EMA moving averages of St Joe JOE
DMA (daily moving average) of St Joe JOE
| DMA period | DMA value | | 5 day DMA | 61.27 | | 12 day DMA | 59.29 | | 20 day DMA | 59.01 | | 35 day DMA | 56.12 | | 50 day DMA | 53.95 | | 100 day DMA | 52.31 | | 150 day DMA | 50.2 | | 200 day DMA | 48.9 | EMA (exponential moving average) of St Joe JOE
| EMA period | EMA current | EMA prev | EMA prev2 | | 5 day EMA | 61.22 | 60.94 | 60.51 | | 12 day EMA | 59.96 | 59.63 | 59.24 | | 20 day EMA | 58.76 | 58.44 | 58.09 | | 35 day EMA | 56.61 | 56.31 | 55.99 | | 50 day EMA | 54.49 | 54.19 | 53.88 |
SMA (simple moving average) of St Joe JOE
| SMA period | SMA current | SMA prev | SMA prev2 | | 5 day SMA | 61.27 | 61.06 | 60.9 | | 12 day SMA | 59.29 | 58.89 | 58.5 | | 20 day SMA | 59.01 | 58.89 | 58.75 | | 35 day SMA | 56.12 | 55.74 | 55.37 | | 50 day SMA | 53.95 | 53.73 | 53.53 | | 100 day SMA | 52.31 | 52.21 | 52.1 | | 150 day SMA | 50.2 | 50.07 | 49.94 | | 200 day SMA | 48.9 | 48.83 | 48.76 |
|
|
