JohnsonJohnson JNJ full analysis,charts,indicators,moving averages,SMA,DMA,EMA,ADX,MACD,RSIJohnson Johnson JNJ WideScreen charts, DMA,SMA,EMA technical analysis, forecast prediction, by indicators ADX,MACD,RSI,CCI USA stock exchange
operates under Health Care sector & deals in Major Pharmaceuticals
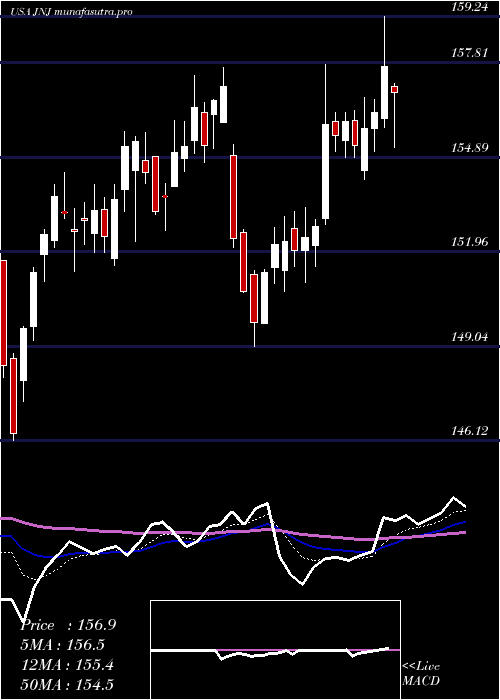
Daily price and charts and targets JohnsonJohnson Strong Daily Stock price targets for JohnsonJohnson JNJ are 200.52 and 203.67 | Daily Target 1 | 199.87 | | Daily Target 2 | 201.17 | | Daily Target 3 | 203.01666666667 | | Daily Target 4 | 204.32 | | Daily Target 5 | 206.17 |
Daily price and volume Johnson Johnson
| Date |
Closing |
Open |
Range |
Volume |
Thu 04 December 2025 |
202.48 (-1.39%) |
204.59 |
201.71 - 204.86 |
1.1086 times |
Wed 03 December 2025 |
205.33 (-0.04%) |
205.90 |
204.99 - 207.02 |
1.0245 times |
Tue 02 December 2025 |
205.42 (0.04%) |
205.24 |
203.10 - 205.61 |
1.0282 times |
Mon 01 December 2025 |
205.34 (-0.76%) |
206.50 |
205.34 - 207.70 |
1.038 times |
Fri 28 November 2025 |
206.92 (-0.27%) |
207.00 |
204.63 - 207.46 |
0.6907 times |
Wed 26 November 2025 |
207.47 (0.39%) |
206.60 |
205.94 - 207.81 |
0.3729 times |
Tue 25 November 2025 |
206.67 (0.36%) |
205.18 |
205.18 - 207.72 |
1.2588 times |
Mon 24 November 2025 |
205.92 (0.99%) |
203.50 |
203.00 - 206.12 |
0.5624 times |
Fri 21 November 2025 |
203.90 (0.41%) |
203.96 |
202.99 - 206.94 |
1.6157 times |
Thu 20 November 2025 |
203.07 (0.28%) |
202.00 |
201.57 - 204.51 |
1.3001 times |
Wed 19 November 2025 |
202.51 (1.26%) |
200.00 |
199.38 - 203.48 |
1.7997 times |
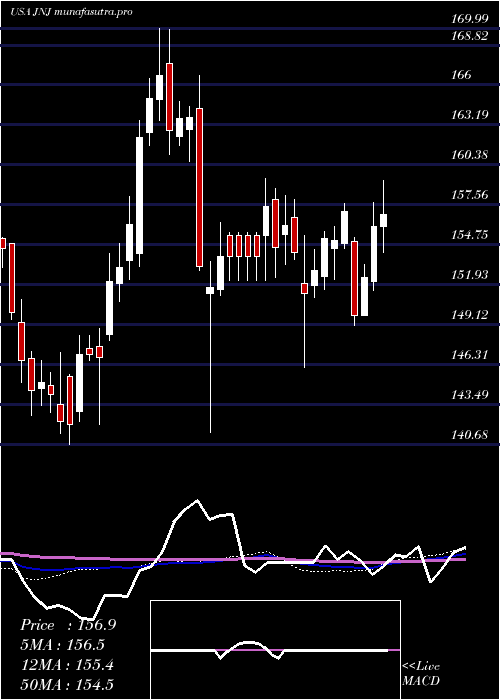
Weekly price and charts JohnsonJohnson Strong weekly Stock price targets for JohnsonJohnson JNJ are 199.1 and 205.09 | Weekly Target 1 | 197.97 | | Weekly Target 2 | 200.23 | | Weekly Target 3 | 203.96333333333 | | Weekly Target 4 | 206.22 | | Weekly Target 5 | 209.95 |
Weekly price and volumes for Johnson Johnson
| Date |
Closing |
Open |
Range |
Volume |
Thu 04 December 2025 |
202.48 (-2.15%) |
206.50 |
201.71 - 207.70 |
1.0046 times |
Fri 28 November 2025 |
206.92 (1.48%) |
203.50 |
203.00 - 207.81 |
0.6901 times |
Fri 21 November 2025 |
203.90 (4.07%) |
196.96 |
195.90 - 206.94 |
1.8819 times |
Fri 14 November 2025 |
195.93 (5.02%) |
186.00 |
185.12 - 197.18 |
1.1442 times |
Fri 07 November 2025 |
186.57 (-1.22%) |
186.43 |
185.37 - 188.35 |
0.5562 times |
Fri 31 October 2025 |
188.87 (0%) |
187.46 |
186.76 - 189.50 |
0.2576 times |
Fri 31 October 2025 |
188.87 (-0.81%) |
189.99 |
184.66 - 190.80 |
1.227 times |
Fri 24 October 2025 |
190.41 (-1.45%) |
193.53 |
189.42 - 194.48 |
0.8176 times |
Fri 17 October 2025 |
193.22 (1.31%) |
189.83 |
185.88 - 194.40 |
1.3798 times |
Fri 10 October 2025 |
190.72 (1.1%) |
189.04 |
182.94 - 192.10 |
1.0408 times |
Fri 03 October 2025 |
188.64 (4.97%) |
179.82 |
179.80 - 189.78 |
1.3811 times |
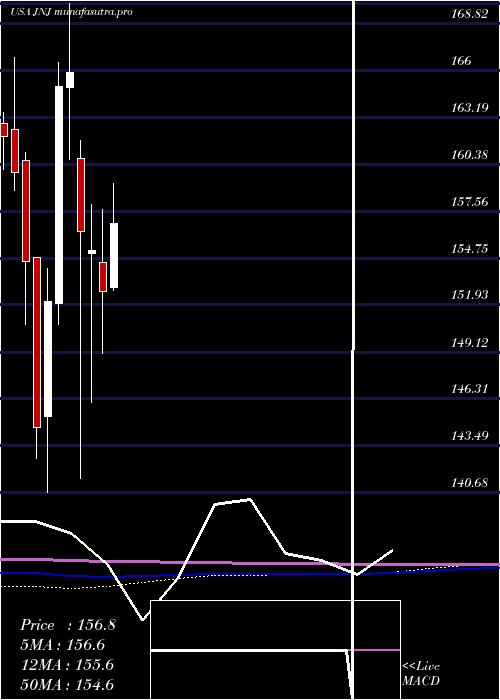
Monthly price and charts JohnsonJohnson Strong monthly Stock price targets for JohnsonJohnson JNJ are 199.1 and 205.09 | Monthly Target 1 | 197.97 | | Monthly Target 2 | 200.23 | | Monthly Target 3 | 203.96333333333 | | Monthly Target 4 | 206.22 | | Monthly Target 5 | 209.95 |
Monthly price and volumes Johnson Johnson
| Date |
Closing |
Open |
Range |
Volume |
Thu 04 December 2025 |
202.48 (-2.15%) |
206.50 |
201.71 - 207.70 |
0.2101 times |
Fri 28 November 2025 |
206.92 (9.56%) |
186.43 |
185.12 - 207.81 |
0.8935 times |
Fri 31 October 2025 |
188.87 (1.86%) |
186.00 |
182.94 - 194.48 |
1.1529 times |
Tue 30 September 2025 |
185.42 (4.66%) |
177.47 |
173.33 - 185.99 |
1.108 times |
Fri 29 August 2025 |
177.17 (7.55%) |
165.48 |
164.79 - 181.16 |
1.0369 times |
Thu 31 July 2025 |
164.74 (7.85%) |
153.00 |
152.81 - 169.99 |
1.1484 times |
Mon 30 June 2025 |
152.75 (-1.58%) |
154.48 |
149.04 - 157.67 |
0.9314 times |
Fri 30 May 2025 |
155.21 (-0.7%) |
155.00 |
146.12 - 157.94 |
1.0679 times |
Wed 30 April 2025 |
156.31 (-5.75%) |
160.73 |
141.50 - 161.81 |
1.3935 times |
Mon 31 March 2025 |
165.84 (0.5%) |
164.96 |
160.64 - 169.99 |
1.0573 times |
Fri 28 February 2025 |
165.02 (8.46%) |
152.00 |
150.78 - 166.43 |
1.0417 times |
DMA SMA EMA moving averages of Johnson Johnson JNJ
DMA (daily moving average) of Johnson Johnson JNJ
| DMA period | DMA value | | 5 day DMA | 205.1 | | 12 day DMA | 204.59 | | 20 day DMA | 199.8 | | 35 day DMA | 195.6 | | 50 day DMA | 193.05 | | 100 day DMA | 183.37 | | 150 day DMA | 173.56 | | 200 day DMA | 169.98 | EMA (exponential moving average) of Johnson Johnson JNJ
| EMA period | EMA current | EMA prev | EMA prev2 | | 5 day EMA | 204.49 | 205.5 | 205.59 | | 12 day EMA | 203.22 | 203.36 | 203 | | 20 day EMA | 200.68 | 200.49 | 199.98 | | 35 day EMA | 196.84 | 196.51 | 195.99 | | 50 day EMA | 192.8 | 192.4 | 191.87 |
SMA (simple moving average) of Johnson Johnson JNJ
| SMA period | SMA current | SMA prev | SMA prev2 | | 5 day SMA | 205.1 | 206.1 | 206.36 | | 12 day SMA | 204.59 | 204.34 | 203.56 | | 20 day SMA | 199.8 | 198.98 | 198.05 | | 35 day SMA | 195.6 | 195.28 | 194.87 | | 50 day SMA | 193.05 | 192.53 | 191.96 | | 100 day SMA | 183.37 | 182.9 | 182.42 | | 150 day SMA | 173.56 | 173.25 | 172.92 | | 200 day SMA | 169.98 | 169.76 | 169.53 |
|
|
