JohnHancock JHI full analysis,charts,indicators,moving averages,SMA,DMA,EMA,ADX,MACD,RSIJohn Hancock JHI WideScreen charts, DMA,SMA,EMA technical analysis, forecast prediction, by indicators ADX,MACD,RSI,CCI USA stock exchange
operates under N A sector & deals in N A
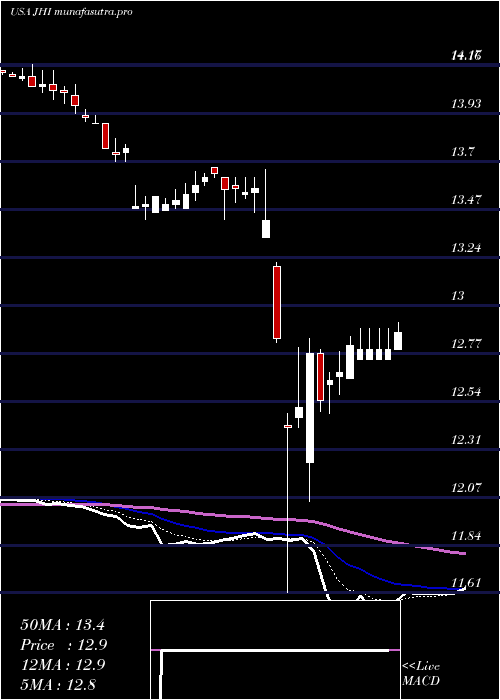
Daily price and charts and targets JohnHancock Strong Daily Stock price targets for JohnHancock JHI are 13.68 and 13.79 | Daily Target 1 | 13.59 | | Daily Target 2 | 13.65 | | Daily Target 3 | 13.703333333333 | | Daily Target 4 | 13.76 | | Daily Target 5 | 13.81 |
Daily price and volume John Hancock
| Date |
Closing |
Open |
Range |
Volume |
Mon 20 October 2025 |
13.70 (0.37%) |
13.68 |
13.65 - 13.76 |
1.0806 times |
Fri 17 October 2025 |
13.65 (-0.44%) |
13.76 |
13.57 - 13.77 |
1.1151 times |
Thu 16 October 2025 |
13.71 (-0.87%) |
13.88 |
13.69 - 13.95 |
1.1036 times |
Wed 15 October 2025 |
13.83 (0.29%) |
13.93 |
13.77 - 13.93 |
1.0308 times |
Tue 14 October 2025 |
13.79 (-1.01%) |
14.03 |
13.76 - 14.03 |
0.7856 times |
Mon 13 October 2025 |
13.93 (-1.28%) |
14.15 |
13.80 - 14.15 |
0.6476 times |
Tue 07 October 2025 |
14.11 (1.07%) |
14.02 |
13.98 - 14.27 |
1.2837 times |
Mon 06 October 2025 |
13.96 (-0.43%) |
14.08 |
13.91 - 14.09 |
0.9319 times |
Fri 03 October 2025 |
14.02 (-0.36%) |
14.13 |
13.99 - 14.13 |
0.7128 times |
Thu 02 October 2025 |
14.07 (0.57%) |
14.10 |
14.00 - 14.12 |
1.3082 times |
Wed 01 October 2025 |
13.99 (0%) |
13.95 |
13.90 - 14.12 |
0.8009 times |
Weekly price and charts JohnHancock Strong weekly Stock price targets for JohnHancock JHI are 13.68 and 13.79 | Weekly Target 1 | 13.59 | | Weekly Target 2 | 13.65 | | Weekly Target 3 | 13.703333333333 | | Weekly Target 4 | 13.76 | | Weekly Target 5 | 13.81 |
Weekly price and volumes for John Hancock
| Date |
Closing |
Open |
Range |
Volume |
Mon 20 October 2025 |
13.70 (0.37%) |
13.68 |
13.65 - 13.76 |
0.246 times |
Fri 17 October 2025 |
13.65 (-3.26%) |
14.15 |
13.57 - 14.15 |
1.0661 times |
Tue 07 October 2025 |
14.11 (0.64%) |
14.08 |
13.91 - 14.27 |
0.5044 times |
Fri 03 October 2025 |
14.02 (0.5%) |
13.86 |
13.86 - 14.13 |
1.4459 times |
Fri 26 September 2025 |
13.95 (-1.9%) |
14.26 |
13.95 - 14.26 |
0.896 times |
Fri 19 September 2025 |
14.22 (0.35%) |
14.19 |
14.11 - 14.46 |
1.1141 times |
Fri 12 September 2025 |
14.17 (-0.63%) |
14.31 |
14.14 - 14.51 |
1.5258 times |
Fri 05 September 2025 |
14.26 (0.56%) |
14.09 |
14.09 - 14.33 |
0.7712 times |
Fri 29 August 2025 |
14.18 (0%) |
14.15 |
14.11 - 14.20 |
0.964 times |
Fri 29 August 2025 |
14.18 (0.71%) |
14.11 |
14.08 - 14.20 |
1.4665 times |
Fri 22 August 2025 |
14.08 (0%) |
14.12 |
13.97 - 14.14 |
0.957 times |

Monthly price and charts JohnHancock Strong monthly Stock price targets for JohnHancock JHI are 13.29 and 13.99 | Monthly Target 1 | 13.15 | | Monthly Target 2 | 13.42 | | Monthly Target 3 | 13.846666666667 | | Monthly Target 4 | 14.12 | | Monthly Target 5 | 14.55 |
Monthly price and volumes John Hancock
| Date |
Closing |
Open |
Range |
Volume |
Mon 20 October 2025 |
13.70 (-2.07%) |
13.95 |
13.57 - 14.27 |
0.6948 times |
Tue 30 September 2025 |
13.99 (-1.34%) |
14.09 |
13.86 - 14.51 |
1.4441 times |
Fri 29 August 2025 |
14.18 (1%) |
14.06 |
13.97 - 14.20 |
1.2106 times |
Thu 31 July 2025 |
14.04 (1.37%) |
13.88 |
13.77 - 14.11 |
0.7022 times |
Mon 30 June 2025 |
13.85 (3.36%) |
13.36 |
13.34 - 13.94 |
0.9715 times |
Fri 30 May 2025 |
13.40 (1.75%) |
13.17 |
13.15 - 13.53 |
0.7712 times |
Wed 30 April 2025 |
13.17 (-2.95%) |
13.54 |
11.61 - 13.66 |
1.5769 times |
Mon 31 March 2025 |
13.57 (-3.55%) |
14.07 |
13.42 - 14.14 |
1.043 times |
Fri 28 February 2025 |
14.07 (0.21%) |
14.00 |
14.00 - 14.24 |
0.6658 times |
Fri 31 January 2025 |
14.04 (2.63%) |
13.82 |
13.76 - 14.17 |
0.9199 times |
Tue 31 December 2024 |
13.68 (-3.59%) |
14.26 |
13.65 - 14.45 |
0.9298 times |

DMA SMA EMA moving averages of John Hancock JHI
DMA (daily moving average) of John Hancock JHI
| DMA period | DMA value | | 5 day DMA | 13.74 | | 12 day DMA | 13.9 | | 20 day DMA | 13.97 | | 35 day DMA | 14.1 | | 50 day DMA | 14.09 | | 100 day DMA | 13.91 | | 150 day DMA | 13.67 | | 200 day DMA | 13.76 | EMA (exponential moving average) of John Hancock JHI
| EMA period | EMA current | EMA prev | EMA prev2 | | 5 day EMA | 13.75 | 13.78 | 13.84 | | 12 day EMA | 13.86 | 13.89 | 13.93 | | 20 day EMA | 13.94 | 13.97 | 14 | | 35 day EMA | 13.99 | 14.01 | 14.03 | | 50 day EMA | 14.05 | 14.06 | 14.08 |
SMA (simple moving average) of John Hancock JHI
| SMA period | SMA current | SMA prev | SMA prev2 | | 5 day SMA | 13.74 | 13.78 | 13.87 | | 12 day SMA | 13.9 | 13.92 | 13.94 | | 20 day SMA | 13.97 | 14 | 14.04 | | 35 day SMA | 14.1 | 14.11 | 14.13 | | 50 day SMA | 14.09 | 14.1 | 14.11 | | 100 day SMA | 13.91 | 13.91 | 13.9 | | 150 day SMA | 13.67 | 13.67 | 13.67 | | 200 day SMA | 13.76 | 13.76 | 13.76 |
|
|
