IllinoisTool ITW full analysis,charts,indicators,moving averages,SMA,DMA,EMA,ADX,MACD,RSIIllinois Tool ITW WideScreen charts, DMA,SMA,EMA technical analysis, forecast prediction, by indicators ADX,MACD,RSI,CCI USA stock exchange
operates under Technology sector & deals in Industrial Machinery Components
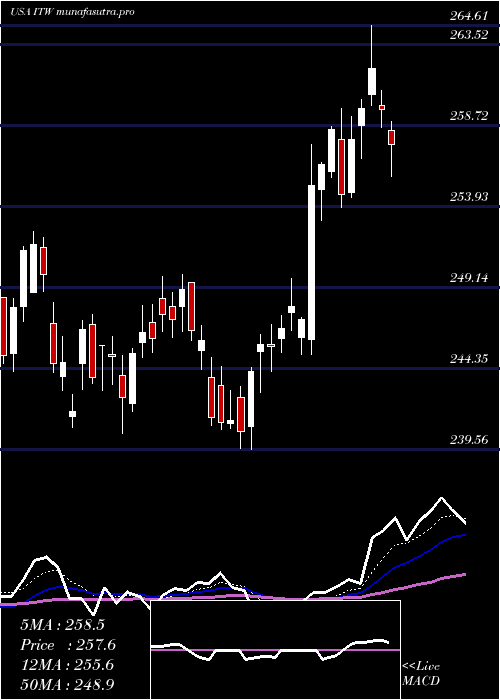
Daily price and charts and targets IllinoisTool Strong Daily Stock price targets for IllinoisTool ITW are 250.78 and 254.44 | Daily Target 1 | 247.8 | | Daily Target 2 | 250.09 | | Daily Target 3 | 251.46 | | Daily Target 4 | 253.75 | | Daily Target 5 | 255.12 |
Daily price and volume Illinois Tool
| Date |
Closing |
Open |
Range |
Volume |
Mon 20 October 2025 |
252.38 (1.25%) |
249.17 |
249.17 - 252.83 |
0.965 times |
Fri 17 October 2025 |
249.26 (0.94%) |
247.36 |
246.80 - 249.52 |
0.8567 times |
Thu 16 October 2025 |
246.94 (-0.3%) |
248.44 |
245.43 - 248.44 |
0.6789 times |
Wed 15 October 2025 |
247.69 (-0.16%) |
248.57 |
245.80 - 249.75 |
0.6942 times |
Tue 14 October 2025 |
248.09 (1.48%) |
242.75 |
242.53 - 249.53 |
1.0743 times |
Mon 13 October 2025 |
244.46 (-0.19%) |
246.54 |
243.50 - 247.35 |
1.033 times |
Fri 10 October 2025 |
244.93 (-1.35%) |
248.92 |
244.23 - 249.94 |
1.2251 times |
Thu 09 October 2025 |
248.29 (-1.76%) |
253.56 |
247.49 - 254.30 |
1.1041 times |
Wed 08 October 2025 |
252.75 (-1.17%) |
256.22 |
251.82 - 256.26 |
1.4699 times |
Tue 07 October 2025 |
255.75 (-1.14%) |
259.35 |
255.42 - 259.61 |
0.8986 times |
Mon 06 October 2025 |
258.71 (-0.5%) |
259.34 |
256.74 - 260.00 |
0.506 times |
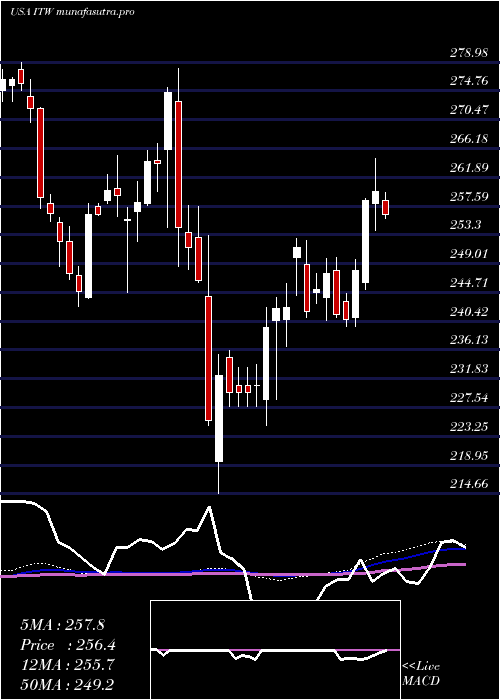
Weekly price and charts IllinoisTool Strong weekly Stock price targets for IllinoisTool ITW are 250.78 and 254.44 | Weekly Target 1 | 247.8 | | Weekly Target 2 | 250.09 | | Weekly Target 3 | 251.46 | | Weekly Target 4 | 253.75 | | Weekly Target 5 | 255.12 |
Weekly price and volumes for Illinois Tool
| Date |
Closing |
Open |
Range |
Volume |
Mon 20 October 2025 |
252.38 (1.25%) |
249.17 |
249.17 - 252.83 |
0.2805 times |
Fri 17 October 2025 |
249.26 (1.77%) |
246.54 |
242.53 - 249.75 |
1.2606 times |
Fri 10 October 2025 |
244.93 (-5.8%) |
259.34 |
244.23 - 260.00 |
1.5124 times |
Fri 03 October 2025 |
260.00 (-0.4%) |
262.46 |
258.00 - 263.20 |
1.1129 times |
Fri 26 September 2025 |
261.04 (-0.31%) |
261.37 |
257.16 - 263.30 |
0.9602 times |
Fri 19 September 2025 |
261.86 (-0.57%) |
264.57 |
261.06 - 268.00 |
1.4586 times |
Fri 12 September 2025 |
263.36 (-1.08%) |
265.51 |
261.17 - 266.93 |
1.108 times |
Fri 05 September 2025 |
266.24 (0.6%) |
263.27 |
259.97 - 268.68 |
0.7954 times |
Fri 29 August 2025 |
264.65 (0%) |
266.07 |
264.04 - 267.15 |
0.2698 times |
Fri 29 August 2025 |
264.65 (-1.77%) |
269.48 |
263.66 - 270.74 |
1.2416 times |
Fri 22 August 2025 |
269.41 (4.16%) |
258.67 |
256.43 - 269.82 |
1.3119 times |
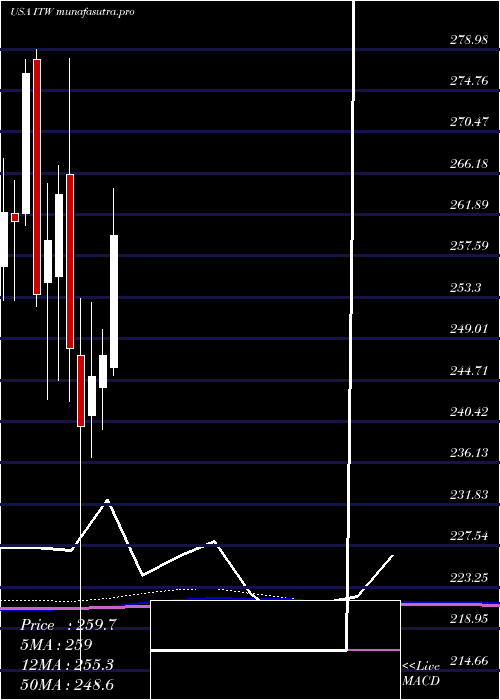
Monthly price and charts IllinoisTool Strong monthly Stock price targets for IllinoisTool ITW are 237.35 and 257.57 | Monthly Target 1 | 232.33 | | Monthly Target 2 | 242.36 | | Monthly Target 3 | 252.55333333333 | | Monthly Target 4 | 262.58 | | Monthly Target 5 | 272.77 |
Monthly price and volumes Illinois Tool
| Date |
Closing |
Open |
Range |
Volume |
Mon 20 October 2025 |
252.38 (-3.21%) |
259.32 |
242.53 - 262.75 |
0.6289 times |
Tue 30 September 2025 |
260.76 (-1.47%) |
263.27 |
257.16 - 268.68 |
0.8443 times |
Fri 29 August 2025 |
264.65 (3.39%) |
253.48 |
249.67 - 270.74 |
0.9498 times |
Thu 31 July 2025 |
255.97 (3.53%) |
246.07 |
245.18 - 264.61 |
1.1203 times |
Mon 30 June 2025 |
247.25 (0.89%) |
243.96 |
239.56 - 249.92 |
0.8014 times |
Fri 30 May 2025 |
245.08 (2.15%) |
241.01 |
236.68 - 252.75 |
1.1289 times |
Wed 30 April 2025 |
239.91 (-3.27%) |
247.26 |
214.66 - 253.23 |
1.3823 times |
Mon 31 March 2025 |
248.01 (-6.05%) |
266.02 |
242.47 - 278.13 |
1.174 times |
Fri 28 February 2025 |
263.98 (1.86%) |
255.50 |
244.69 - 266.98 |
1.0043 times |
Fri 31 January 2025 |
259.16 (2.21%) |
254.82 |
242.69 - 265.12 |
0.9658 times |
Tue 31 December 2024 |
253.56 (-8.3%) |
278.02 |
252.41 - 278.98 |
0.6812 times |
DMA SMA EMA moving averages of Illinois Tool ITW
DMA (daily moving average) of Illinois Tool ITW
| DMA period | DMA value | | 5 day DMA | 248.87 | | 12 day DMA | 250.77 | | 20 day DMA | 254.59 | | 35 day DMA | 258.37 | | 50 day DMA | 260.04 | | 100 day DMA | 256.11 | | 150 day DMA | 251.22 | | 200 day DMA | 252.85 | EMA (exponential moving average) of Illinois Tool ITW
| EMA period | EMA current | EMA prev | EMA prev2 | | 5 day EMA | 249.65 | 248.29 | 247.8 | | 12 day EMA | 251.12 | 250.89 | 251.19 | | 20 day EMA | 253.39 | 253.5 | 253.95 | | 35 day EMA | 256.08 | 256.3 | 256.71 | | 50 day EMA | 258.68 | 258.94 | 259.33 |
SMA (simple moving average) of Illinois Tool ITW
| SMA period | SMA current | SMA prev | SMA prev2 | | 5 day SMA | 248.87 | 247.29 | 246.42 | | 12 day SMA | 250.77 | 251.47 | 252.36 | | 20 day SMA | 254.59 | 255.01 | 255.64 | | 35 day SMA | 258.37 | 258.72 | 259.16 | | 50 day SMA | 260.04 | 260.13 | 260.29 | | 100 day SMA | 256.11 | 256.06 | 255.98 | | 150 day SMA | 251.22 | 251.24 | 251.24 | | 200 day SMA | 252.85 | 252.84 | 252.86 |
|
|
