IttInc ITT full analysis,charts,indicators,moving averages,SMA,DMA,EMA,ADX,MACD,RSIItt Inc ITT WideScreen charts, DMA,SMA,EMA technical analysis, forecast prediction, by indicators ADX,MACD,RSI,CCI USA stock exchange
operates under Capital Goods sector & deals in Fluid Controls
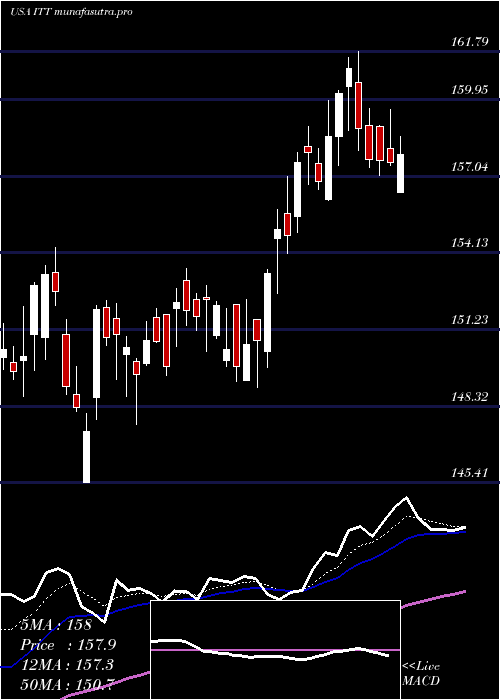
Daily price and charts and targets IttInc Strong Daily Stock price targets for IttInc ITT are 181.71 and 185.09 | Daily Target 1 | 178.91 | | Daily Target 2 | 181.13 | | Daily Target 3 | 182.28666666667 | | Daily Target 4 | 184.51 | | Daily Target 5 | 185.67 |
Daily price and volume Itt Inc
| Date |
Closing |
Open |
Range |
Volume |
Thu 04 December 2025 |
183.36 (1.53%) |
180.41 |
180.06 - 183.44 |
0.5195 times |
Wed 03 December 2025 |
180.59 (0.6%) |
177.56 |
177.48 - 183.39 |
0.8002 times |
Tue 02 December 2025 |
179.52 (-1.5%) |
183.86 |
177.94 - 185.53 |
1.2473 times |
Mon 01 December 2025 |
182.25 (-1.04%) |
182.80 |
181.40 - 184.48 |
1.2617 times |
Fri 28 November 2025 |
184.16 (-0.08%) |
184.30 |
182.26 - 184.68 |
0.4579 times |
Wed 26 November 2025 |
184.30 (0.43%) |
183.50 |
183.23 - 185.77 |
0.8136 times |
Tue 25 November 2025 |
183.52 (1.47%) |
182.26 |
180.27 - 184.24 |
0.8601 times |
Mon 24 November 2025 |
180.86 (1.04%) |
178.32 |
178.32 - 182.48 |
1.3069 times |
Fri 21 November 2025 |
178.99 (0.07%) |
179.07 |
176.48 - 181.33 |
1.9341 times |
Thu 20 November 2025 |
178.87 (-2.05%) |
186.26 |
178.55 - 187.35 |
0.7987 times |
Wed 19 November 2025 |
182.62 (0.34%) |
182.01 |
180.62 - 185.19 |
0.935 times |
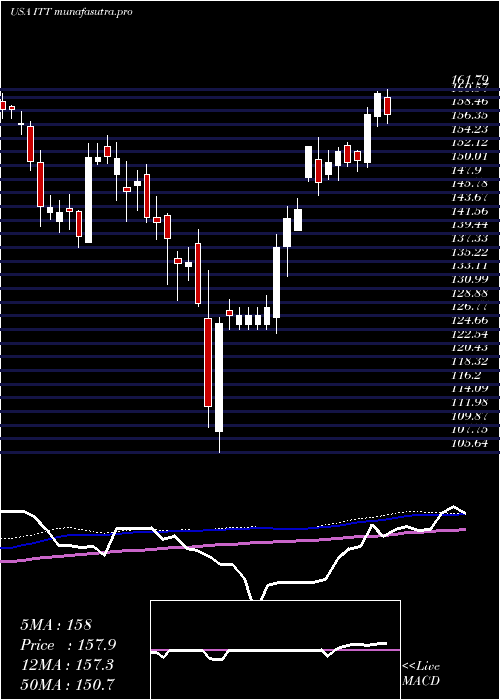
Weekly price and charts IttInc Strong weekly Stock price targets for IttInc ITT are 180.42 and 188.47 | Weekly Target 1 | 174.07 | | Weekly Target 2 | 178.72 | | Weekly Target 3 | 182.12333333333 | | Weekly Target 4 | 186.77 | | Weekly Target 5 | 190.17 |
Weekly price and volumes for Itt Inc
| Date |
Closing |
Open |
Range |
Volume |
Thu 04 December 2025 |
183.36 (-0.43%) |
182.80 |
177.48 - 185.53 |
1.2729 times |
Fri 28 November 2025 |
184.16 (2.89%) |
178.32 |
178.32 - 185.77 |
1.1431 times |
Fri 21 November 2025 |
178.99 (-3.08%) |
184.68 |
176.48 - 187.35 |
1.6574 times |
Fri 14 November 2025 |
184.68 (-1.87%) |
190.42 |
179.63 - 192.78 |
0.845 times |
Fri 07 November 2025 |
188.19 (1.69%) |
183.59 |
180.40 - 193.83 |
0.7557 times |
Fri 31 October 2025 |
185.07 (0%) |
187.04 |
184.22 - 188.20 |
0.2722 times |
Fri 31 October 2025 |
185.07 (4.94%) |
178.42 |
175.35 - 197.07 |
1.8684 times |
Fri 24 October 2025 |
176.35 (1.97%) |
174.71 |
170.48 - 178.10 |
1.0169 times |
Fri 17 October 2025 |
172.94 (-3.24%) |
173.79 |
168.49 - 175.54 |
0.9398 times |
Tue 07 October 2025 |
178.74 (-1.34%) |
182.29 |
177.42 - 182.74 |
0.2286 times |
Fri 03 October 2025 |
181.16 (2.45%) |
178.36 |
176.43 - 183.04 |
0.7552 times |
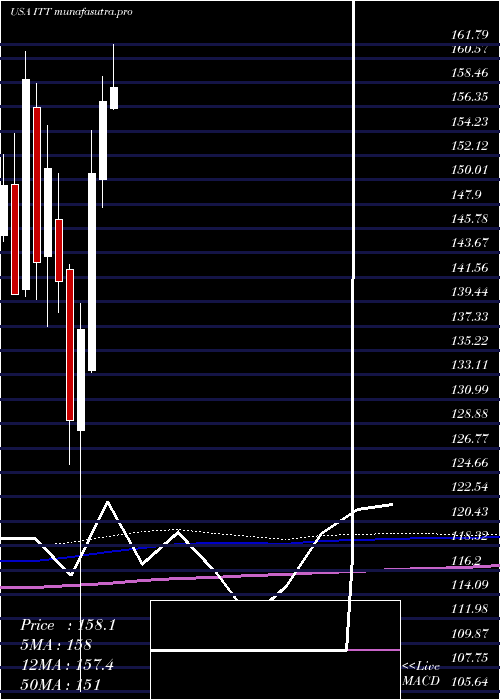
Monthly price and charts IttInc Strong monthly Stock price targets for IttInc ITT are 180.42 and 188.47 | Monthly Target 1 | 174.07 | | Monthly Target 2 | 178.72 | | Monthly Target 3 | 182.12333333333 | | Monthly Target 4 | 186.77 | | Monthly Target 5 | 190.17 |
Monthly price and volumes Itt Inc
| Date |
Closing |
Open |
Range |
Volume |
Thu 04 December 2025 |
183.36 (-0.43%) |
182.80 |
177.48 - 185.53 |
0.2802 times |
Fri 28 November 2025 |
184.16 (-0.49%) |
183.59 |
176.48 - 193.83 |
0.9689 times |
Fri 31 October 2025 |
185.07 (3.53%) |
178.00 |
168.49 - 197.07 |
1.0556 times |
Tue 30 September 2025 |
178.76 (5%) |
168.95 |
167.22 - 185.57 |
0.9579 times |
Fri 29 August 2025 |
170.25 (0.17%) |
166.00 |
163.30 - 174.73 |
0.715 times |
Thu 31 July 2025 |
169.96 (8.37%) |
156.16 |
154.30 - 170.16 |
0.9508 times |
Mon 30 June 2025 |
156.83 (4.18%) |
150.02 |
147.63 - 158.94 |
0.8603 times |
Fri 30 May 2025 |
150.54 (9.87%) |
133.48 |
133.36 - 154.31 |
1.2346 times |
Wed 30 April 2025 |
137.02 (6.09%) |
128.30 |
105.64 - 139.33 |
1.77 times |
Mon 31 March 2025 |
129.16 (-8.55%) |
142.22 |
125.36 - 142.65 |
1.2066 times |
Fri 28 February 2025 |
141.24 (-6.48%) |
146.60 |
138.52 - 150.56 |
0.9514 times |
DMA SMA EMA moving averages of Itt Inc ITT
DMA (daily moving average) of Itt Inc ITT
| DMA period | DMA value | | 5 day DMA | 181.98 | | 12 day DMA | 181.75 | | 20 day DMA | 183.89 | | 35 day DMA | 182.07 | | 50 day DMA | 180.69 | | 100 day DMA | 174.22 | | 150 day DMA | 166.29 | | 200 day DMA | 157.98 | EMA (exponential moving average) of Itt Inc ITT
| EMA period | EMA current | EMA prev | EMA prev2 | | 5 day EMA | 182.03 | 181.36 | 181.74 | | 12 day EMA | 182.39 | 182.21 | 182.51 | | 20 day EMA | 182.58 | 182.5 | 182.7 | | 35 day EMA | 181.82 | 181.73 | 181.8 | | 50 day EMA | 180.83 | 180.73 | 180.74 |
SMA (simple moving average) of Itt Inc ITT
| SMA period | SMA current | SMA prev | SMA prev2 | | 5 day SMA | 181.98 | 182.16 | 182.75 | | 12 day SMA | 181.75 | 181.65 | 182 | | 20 day SMA | 183.89 | 184.14 | 184.4 | | 35 day SMA | 182.07 | 181.77 | 181.53 | | 50 day SMA | 180.69 | 180.64 | 180.69 | | 100 day SMA | 174.22 | 173.96 | 173.73 | | 150 day SMA | 166.29 | 165.98 | 165.7 | | 200 day SMA | 157.98 | 157.8 | 157.63 |
|
|
