IturanLocation ITRN full analysis,charts,indicators,moving averages,SMA,DMA,EMA,ADX,MACD,RSIIturan Location ITRN WideScreen charts, DMA,SMA,EMA technical analysis, forecast prediction, by indicators ADX,MACD,RSI,CCI USA stock exchange
operates under Consumer Non Durables sector & deals in Electronic Components
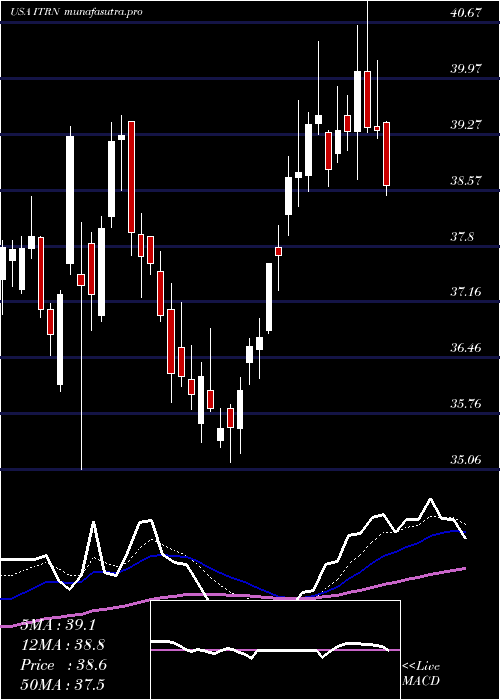
Daily price and charts and targets IturanLocation Strong Daily Stock price targets for IturanLocation ITRN are 36.87 and 37.92 | Daily Target 1 | 36.11 | | Daily Target 2 | 36.58 | | Daily Target 3 | 37.16 | | Daily Target 4 | 37.63 | | Daily Target 5 | 38.21 |
Daily price and volume Ituran Location
| Date |
Closing |
Open |
Range |
Volume |
Mon 20 October 2025 |
37.05 (0%) |
36.81 |
36.69 - 37.74 |
0.6226 times |
Fri 17 October 2025 |
37.05 (-1.67%) |
37.43 |
36.29 - 37.52 |
1.0451 times |
Thu 16 October 2025 |
37.68 (0.16%) |
37.84 |
37.32 - 37.94 |
0.9445 times |
Wed 15 October 2025 |
37.62 (1.79%) |
37.02 |
36.74 - 37.63 |
1.7927 times |
Tue 14 October 2025 |
36.96 (1.34%) |
36.28 |
35.85 - 37.36 |
0.7565 times |
Mon 13 October 2025 |
36.47 (3.17%) |
36.04 |
35.00 - 36.69 |
0.8483 times |
Fri 10 October 2025 |
35.35 (-0.56%) |
35.67 |
35.13 - 35.72 |
1.3083 times |
Thu 09 October 2025 |
35.55 (0.06%) |
35.77 |
35.28 - 35.94 |
0.7244 times |
Wed 08 October 2025 |
35.53 (-1.42%) |
36.06 |
35.43 - 36.43 |
0.7587 times |
Tue 07 October 2025 |
36.04 (-0.85%) |
36.48 |
35.59 - 36.49 |
1.1988 times |
Mon 06 October 2025 |
36.35 (1.23%) |
35.86 |
35.70 - 36.64 |
0.7111 times |
Weekly price and charts IturanLocation Strong weekly Stock price targets for IturanLocation ITRN are 36.87 and 37.92 | Weekly Target 1 | 36.11 | | Weekly Target 2 | 36.58 | | Weekly Target 3 | 37.16 | | Weekly Target 4 | 37.63 | | Weekly Target 5 | 38.21 |
Weekly price and volumes for Ituran Location
| Date |
Closing |
Open |
Range |
Volume |
Mon 20 October 2025 |
37.05 (0%) |
36.81 |
36.69 - 37.74 |
0.1098 times |
Fri 17 October 2025 |
37.05 (4.81%) |
36.04 |
35.00 - 37.94 |
0.9501 times |
Fri 10 October 2025 |
35.35 (-1.56%) |
35.86 |
35.13 - 36.64 |
0.8292 times |
Fri 03 October 2025 |
35.91 (2.37%) |
35.29 |
35.01 - 36.22 |
0.7433 times |
Fri 26 September 2025 |
35.08 (-1.65%) |
35.72 |
33.98 - 36.11 |
0.7227 times |
Fri 19 September 2025 |
35.67 (2%) |
34.90 |
34.90 - 36.39 |
1.2524 times |
Fri 12 September 2025 |
34.97 (3.55%) |
33.90 |
33.61 - 35.38 |
0.9005 times |
Fri 05 September 2025 |
33.77 (0.15%) |
32.86 |
32.71 - 34.35 |
1.3299 times |
Fri 29 August 2025 |
33.72 (0%) |
33.63 |
33.40 - 34.35 |
0.6043 times |
Fri 29 August 2025 |
33.72 (-9.16%) |
37.10 |
32.91 - 37.12 |
2.5579 times |
Fri 22 August 2025 |
37.12 (-8.86%) |
40.73 |
35.04 - 40.90 |
1.718 times |
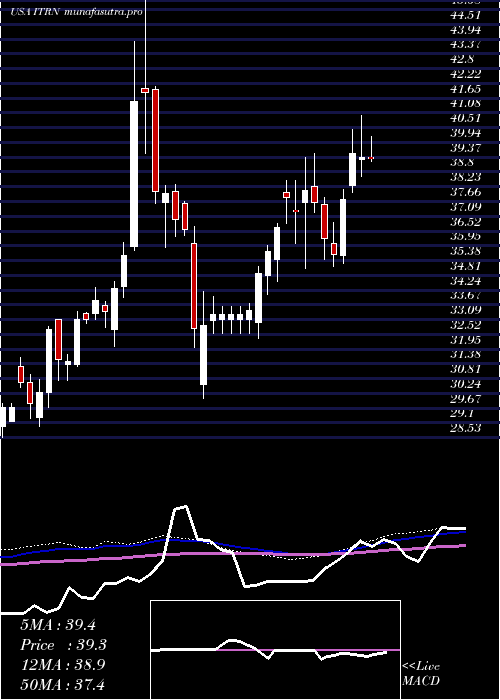
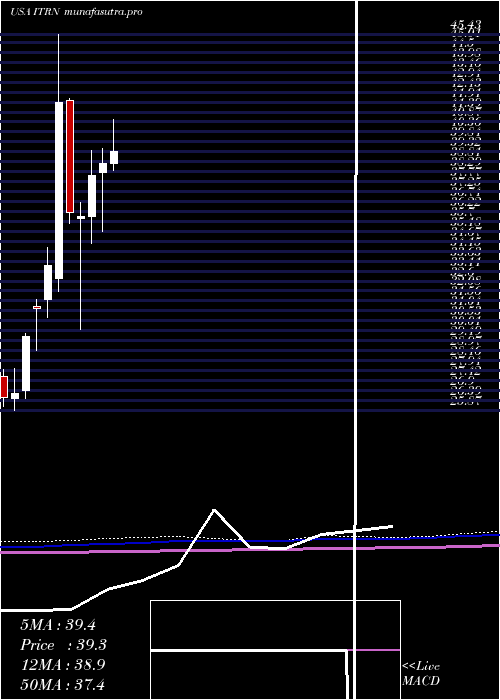
Monthly price and charts IturanLocation Strong monthly Stock price targets for IturanLocation ITRN are 36.03 and 38.97 | Monthly Target 1 | 33.72 | | Monthly Target 2 | 35.39 | | Monthly Target 3 | 36.663333333333 | | Monthly Target 4 | 38.33 | | Monthly Target 5 | 39.6 |
Monthly price and volumes Ituran Location
| Date |
Closing |
Open |
Range |
Volume |
Mon 20 October 2025 |
37.05 (3.72%) |
35.53 |
35.00 - 37.94 |
0.4493 times |
Tue 30 September 2025 |
35.72 (5.93%) |
32.86 |
32.71 - 36.39 |
0.8979 times |
Fri 29 August 2025 |
33.72 (-14.63%) |
39.00 |
32.91 - 42.89 |
1.2581 times |
Thu 31 July 2025 |
39.50 (1.99%) |
38.73 |
38.27 - 41.18 |
0.7032 times |
Mon 30 June 2025 |
38.73 (1.68%) |
38.23 |
35.15 - 39.51 |
0.6973 times |
Fri 30 May 2025 |
38.09 (5.98%) |
35.98 |
34.56 - 39.37 |
0.6479 times |
Wed 30 April 2025 |
35.94 (-0.61%) |
35.87 |
30.06 - 36.69 |
0.7786 times |
Mon 31 March 2025 |
36.16 (-13.66%) |
42.00 |
35.61 - 42.09 |
1.0878 times |
Fri 28 February 2025 |
41.88 (25.43%) |
32.70 |
32.07 - 45.43 |
2.5568 times |
Fri 31 January 2025 |
33.39 (7.19%) |
31.63 |
30.72 - 34.35 |
0.9231 times |
Tue 31 December 2024 |
31.15 (4.92%) |
31.29 |
28.96 - 31.64 |
0.4365 times |
DMA SMA EMA moving averages of Ituran Location ITRN
DMA (daily moving average) of Ituran Location ITRN
| DMA period | DMA value | | 5 day DMA | 37.27 | | 12 day DMA | 36.46 | | 20 day DMA | 36 | | 35 day DMA | 35.5 | | 50 day DMA | 36.14 | | 100 day DMA | 37.37 | | 150 day DMA | 36.72 | | 200 day DMA | 36.48 | EMA (exponential moving average) of Ituran Location ITRN
| EMA period | EMA current | EMA prev | EMA prev2 | | 5 day EMA | 37.04 | 37.04 | 37.03 | | 12 day EMA | 36.59 | 36.51 | 36.41 | | 20 day EMA | 36.35 | 36.28 | 36.2 | | 35 day EMA | 36.47 | 36.44 | 36.4 | | 50 day EMA | 36.68 | 36.67 | 36.65 |
SMA (simple moving average) of Ituran Location ITRN
| SMA period | SMA current | SMA prev | SMA prev2 | | 5 day SMA | 37.27 | 37.16 | 36.82 | | 12 day SMA | 36.46 | 36.34 | 36.22 | | 20 day SMA | 36 | 35.92 | 35.85 | | 35 day SMA | 35.5 | 35.4 | 35.31 | | 50 day SMA | 36.14 | 36.23 | 36.33 | | 100 day SMA | 37.37 | 37.4 | 37.4 | | 150 day SMA | 36.72 | 36.73 | 36.73 | | 200 day SMA | 36.48 | 36.45 | 36.42 |
|
|
